Original Link: https://www.anandtech.com/show/13512/the-crucial-p1-1tb-ssd-review
The Crucial P1 1TB SSD Review: The Other Consumer QLC SSD
by Billy Tallis on November 8, 2018 9:00 AM EST
The Crucial P1 SSD isn't quite the first at anything, but it is still a very novel product. It is the second consumer SSD on the market to use four bit per cell (QLC) NAND flash memory, after the Intel SSD 660p. It's the second QLC SSD from Micron, after their 5210 ION enterprise SATA SSD that started shipping to select partners in May (and is now starting to be more widely available).
More importantly however, it is the first consumer NVMe SSD that Micron has actually shipped. For all of their storied history in the SSD industry, Micron is pretty much the last SSD maker to enter the consumer NVMe market; and not for a lack of trying. The company's first attempt at an NVMe drive, the 2016 Ballistix TX3, was ready to hit the market but was canceled when it became clear that it would not have been competitive. So this drive is a very important one for the company, despite the fact that its use of an NVMe/PCIe interface is hardly the most interesting aspect of the Crucial P1.
Under the hood, the Crucial P1 starts from the same basic ingredients as the Intel 660p: Intel/Micron 64-layer 3D QLC NAND and the Silicon Motion SM2263 controller. Micron has added their own firmware customization atop Silicon Motion's work, and the design of the Crucial P1 differs from the Intel 660p in several aspects — so this is not a case of two brands selling the exact same reference design SSD.
Where the Intel 660p includes just 256MB of DRAM regardless of drive capacity, the Crucial P1 includes the same 1GB DRAM per 1TB NAND ratio that is used by most mainstream SSDs. This extra DRAM on the Crucial P1 should enable marginal improvements on benchmarks and workloads that touch large amounts of data, and probably allows a slight simplification to the drive's firmware. The Crucial P1 also has slightly lower usable capacities, eg. 500GB instead of 512GB, so there's a bit more spare area for the controller to work with. And whereas Intel's 2TB 660p is still a single-sided M.2 module, the upcoming 2TB Crucial P1 will have NAND and DRAM on both sides.


The rest of the architecture of the Crucial P1 follows the same general strategies as the Intel 660p. The SM2263 controller is the smaller four-channel design from Silicon Motion's current generation, though it is a step above the DRAMless SM2263XT variant. The host interface is a PCIe 3.0 x4 link, but the Crucial P1 barely needs more than the PCIe 3.0 x2 link used by some competing entry-level NVMe controllers: peak sequential transfers for the P1 are only about 2GB/s.
| Crucial P1 SSD Specifications | |||||
| Capacity | 500 GB | 1 TB | 2 TB | ||
| Form Factor | Single-sided M.2 2280 | Double-sided M.2 2280 | |||
| Interface | NVMe 1.3 PCIe 3.0 x4 | ||||
| Controller | Silicon Motion SM2263 | ||||
| NAND Flash | Micron 64L 3D QLC NAND | ||||
| DRAM | 512MB DDR3 | 1GB DDR3 | 2GB DDR4 | ||
| Sequential Read | 1900 MB/s | 2000 MB/s | 2000 MB/s | ||
| Sequential Write | 950 MB/s | 1700 MB/s | 1750 MB/s | ||
| Random Read | 90k IOPS | 170k IOPS | 250k IOPS | ||
| Random Write | 220k IOPS | 240k IOPS | 250k IOPS | ||
| SLC Write Cache (approximate) | 5GB min 50GB max |
12GB min 100GB max |
24GB min 200GB max |
||
| Power | Max | 8W | |||
| Idle | 2mW (PS4), 80mW (PS3) | ||||
| Warranty | 5 years | ||||
| Write Endurance | 100 TB 0.1 DWPD |
200 TB 0.1 DWPD |
400 TB 0.1 DWPD |
||
| MSRP | $109.99 (22¢/GB) | $219.99 (22¢/GB) | TBA | ||
The use of QLC NAND means that the Crucial P1 is highly reliant on its SLC write cache to enable performance that can exceed what SATA SSDs provide. This is because the drive's QLC NAND isn't all that high performing on its own; it's dense, but it takes longer to program a block than MLC or TLC NAND. TLC for that matter is cache-sensitive for similar reasons, but QLC in turn has cranked up the importance of cache sizes and caching algorithms another notch, as the performance delta between the cache and the actual storage has increased.
For Crucial's P1 the SLC cache is variable in size, and on a nearly-empty drive the cache will be substantially larger than what is usually found on TLC SSDs. Consumer drives that use TLC NAND often try to limit the maximum size of their SLC caches in order to reduce the amount of background work necessary in the event that the SLC write cache should overflow. The Crucial P1 is designed to do as much as possible to avoid falling off that performance cliff, rather than attempt to mitigate the effects when it does happen.
When the SLC cache fills up, writes to the P1 get very slow. The P1 doesn't bypass the cache when it is full, so everything written to the drive is written to SLC first before being folded into QLC blocks. (This helps the P1 offer similar partial power loss protection to the Crucial MX series of SATA SSDs.) The P1 also tends to keep data in SLC so it can serve as a read cache instead of aggressively folding data into QLC blocks during idle time.
All told, the caching strategy of the Crucial P1 maximizes performance and endurance for typical lightweight consumer/client storage workloads, but at the cost of performance on storage-intensive workloads. The P1 is definitely not the SSD to use in a workstation that regularly reads and writes datasets of many gigabytes, but it should be fine for more common desktop usage that is fairly read-heavy and only does multiple GB of writes on rare occasions such as when installing large software packages. This is in some sense just an amplification of the trends we saw as the SSD market moved from MLC to TLC NAND, but we do now have high-end TLC drives that can maintain high write speeds even after their SLC caches have filled. This is not true of the current two consumer QLC SSDs, and will probably always be a significant weakness of QLC SSDs.
The other major tradeoff to the Crucial P1's use of QLC NAND is the lower write endurance compared to TLC SSDs. The P1 is rated for about 0.1 drive writes per day under a five-year warranty, while most consumer SSDs are rated for 0.3 up to about 1.0 DWPD for either three or five years. The P1 somewhat mitigates this by only offering large capacities of 500GB and up, so the total write endurance starts at a minimum of 100TB. This is adequate provided that most of the drive's capacity is used for static data. If the P1 has to hold hundreds of GB of data that changes as frequently as a web browser's cache and history, then 0.1 DWPD won't be enough. But in a more normal scenario where most of the data is media like movies and video games, then there's no problem.
The early projections for QLC NAND write endurance were in the ballpark of a few hundred program/erase cycles at most, which would have required the QLC SSDs to be treated very carefully. The QLC NAND that Micron is now producing in volume can last for a similar number of P/E cycles as early TLC NAND, which is how the Crucial P1 can be usable for general-purpose consumer storage duties. Even after accounting for the write amplification caused by SLC caching and a realistic proportion of writes being random, the P1 is still rated for the equivalent of 200 full drive writes on the host side. (If those drive writes were entirely large-block sequential writes such as from re-imaging an entire drive, then the P1 should last much longer, but Micron doesn't want to complicate the endurance specs for their consumer drives that much.)
In spite of the tradeoffs of lower performance and endurance, QLC drives like the Crucial P1 are worth a look because of their potential to also have significantly lower prices. At around 22¢/GB currently, the P1 isn't setting any records yet. Several industry reports have indicated that yields of Intel/Micron QLC are still poor, so the production costs of SSD-quality QLC aren't meaningfully lower than TLC yet. The other major NAND manufacturers are being less aggressive about bringing QLC to market, but once they have introduced their competitors we will probably see QLC products offering a more significant discount over TLC. NAND prices in general are also in decline, with some higher-volume TLC products leading the way ahead of even the QLC drives.
The primary competition for the Crucial P1 is its close relative Intel 660p, as well as other entry-level NVMe SSDs. There is a low-end NVMe market segment with numerous options, but they are all struggling under the pressure from more competitively priced high-end NVMe SSDs. Products like the DRAMless Toshiba RC100 and HP EX900 haven't been able to get any traction when the HP EX920 is hitting the same prices. Thus, it is also fair to compare the Crucial P1 against such faster NVMe drives. The P1 is a modest step up in price over mainstream SATA SSDs, so this review includes benchmark results from the Crucial MX500.
| AnandTech 2018 Consumer SSD Testbed | |
| CPU | Intel Xeon E3 1240 v5 |
| Motherboard | ASRock Fatal1ty E3V5 Performance Gaming/OC |
| Chipset | Intel C232 |
| Memory | 4x 8GB G.SKILL Ripjaws DDR4-2400 CL15 |
| Graphics | AMD Radeon HD 5450, 1920x1200@60Hz |
| Software | Windows 10 x64, version 1709 |
| Linux kernel version 4.14, fio version 3.6 | |
| Spectre/Meltdown microcode and OS patches current as of May 2018 | |
- Thanks to Intel for the Xeon E3 1240 v5 CPU
- Thanks to ASRock for the E3V5 Performance Gaming/OC
- Thanks to G.SKILL for the Ripjaws DDR4-2400 RAM
- Thanks to Corsair for the RM750 power supply, Carbide 200R case, and Hydro H60 CPU cooler
- Thanks to Quarch for the XLC Programmable Power Module and accessories
- Thanks to StarTech for providing a RK2236BKF 22U rack cabinet.
AnandTech Storage Bench - The Destroyer
The Destroyer is an extremely long test replicating the access patterns of very IO-intensive desktop usage. A detailed breakdown can be found in this article. Like real-world usage, the drives do get the occasional break that allows for some background garbage collection and flushing caches, but those idle times are limited to 25ms so that it doesn't take all week to run the test. These AnandTech Storage Bench (ATSB) tests do not involve running the actual applications that generated the workloads, so the scores are relatively insensitive to changes in CPU performance and RAM from our new testbed, but the jump to a newer version of Windows and the newer storage drivers can have an impact.
We quantify performance on this test by reporting the drive's average data throughput, the average latency of the I/O operations, and the total energy used by the drive over the course of the test.
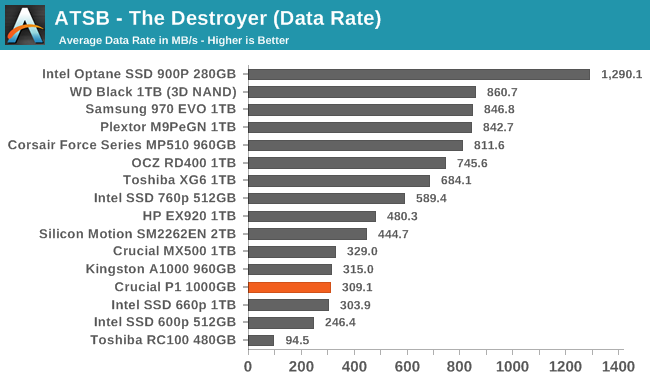
The average data rate from the Crucial P1 on The Destroyer is comparable to other entry-level NVMe drives like the Phison E8-based Kingston A1000 and the Intel 660p. The P1 also roughly matches the average data rate of the Crucial MX500 SATA SSD, while several high-end NVMe drives deliver more than twice the performance.
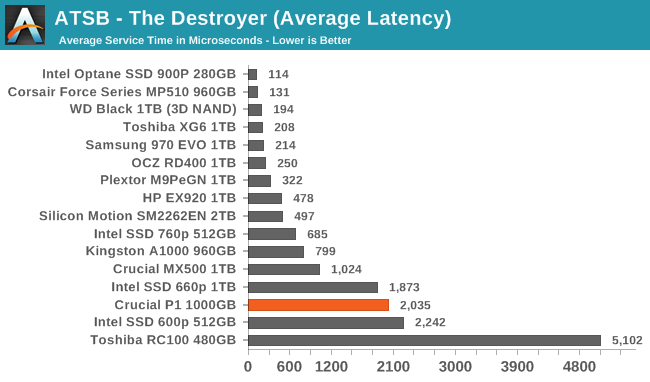
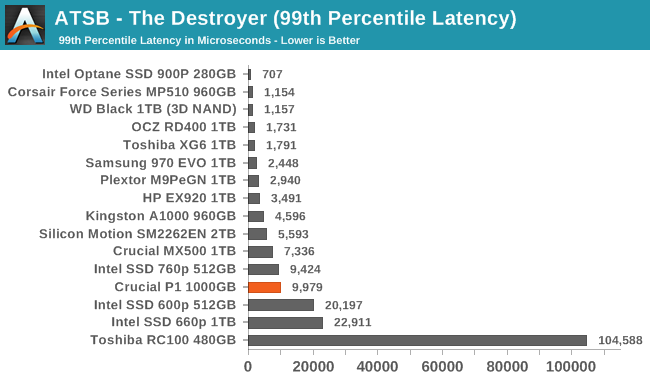
While the average data rate from the Crucial P1 may have been similar to the MX500, the average latency is about twice that of the MX500, and slightly higher than the Intel 660p. The situation is better for the 99th percentile latency, where the Crucial P1 comes close to the MX500 and shows half the 99th percentile latency of the Intel 660p.
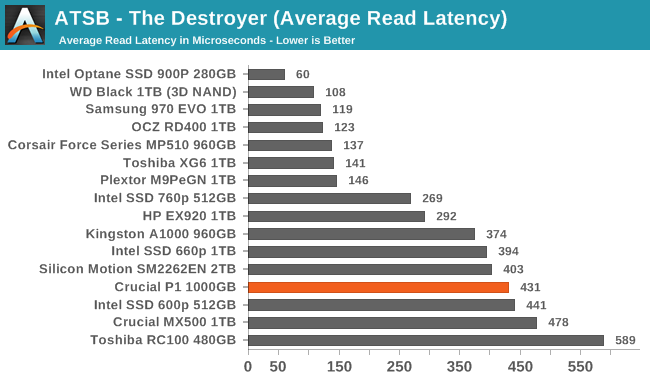
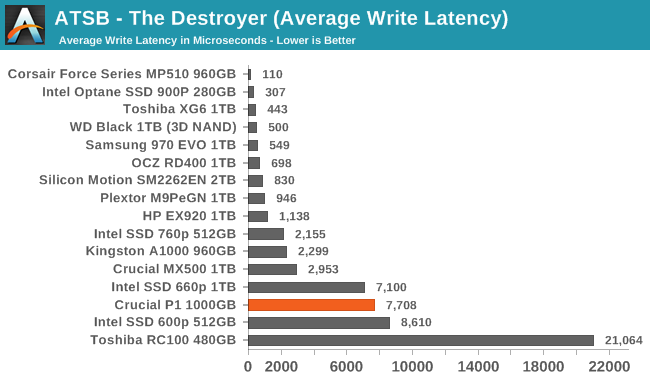
The average read and write latencies for the Crucial P1 on The Destroyer are both slightly worse than what the Intel 660p provides, and the Crucial MX500 provides a much better average write latency.
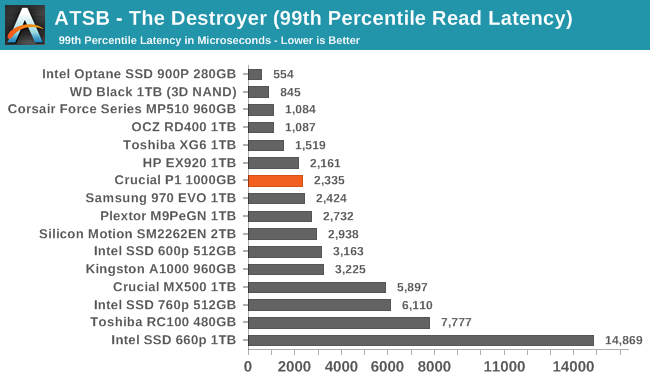
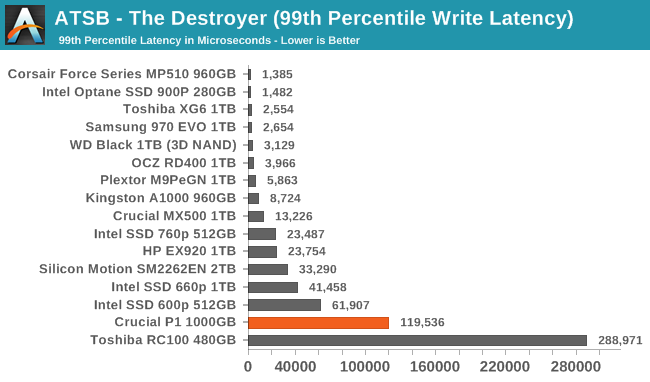
The 99th percentile read latency from the Crucial P1 is very good, competitive with several high-end NVMe SSDs. However, the 99th percentile write latency is quite poor compared to almost any other NVMe SSD or mainstream SATA SSD. This is a huge difference in behavior compared to the Intel 660p. The Crucial P1 is optimized much more for reliable read latency, at significant cost to worst-case write latency under heavy workloads.
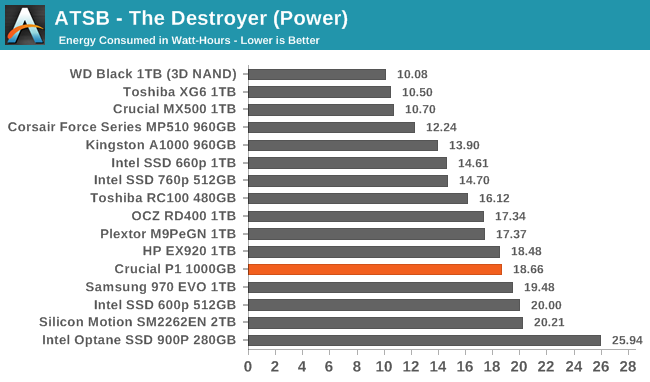
The Crucial P1 requires significantly more energy to complete The Destroyer than the Intel 660p, despite the near-identical hardware and very similar overall performance numbers. The Crucial P1's relatively poor efficiency on this test isn't a serious issue given that the drive is intended for less demanding use cases, but combined with the high 99th percentile write latency this points to the P1 possibly experiencing higher write amplification on The Destroyer than the Intel 660p experiences.
AnandTech Storage Bench - Heavy
Our Heavy storage benchmark is proportionally more write-heavy than The Destroyer, but much shorter overall. The total writes in the Heavy test aren't enough to fill the drive, so performance never drops down to steady state. This test is far more representative of a power user's day to day usage, and is heavily influenced by the drive's peak performance. The Heavy workload test details can be found here. This test is run twice, once on a freshly erased drive and once after filling the drive with sequential writes.
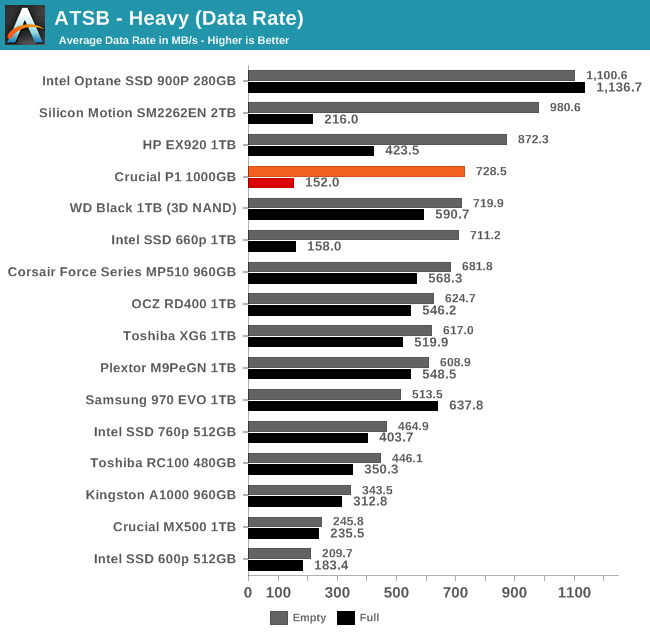
When the Heavy test is run on an empty drive, the large SLC cache of the Crucial P1 enables it to deliver an average data rate that is competitive with most high-end NVMe SSDs. When the drive is full and the SLC cache's size is greatly reduced, the performance drops to well below that of a typical mainstream SATA SSD. This behavior is essentially the same as that shown by the Intel 660p.
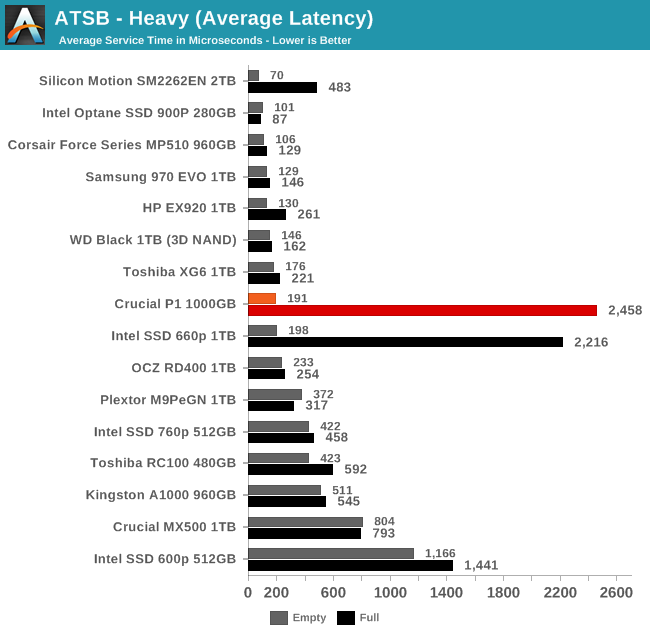
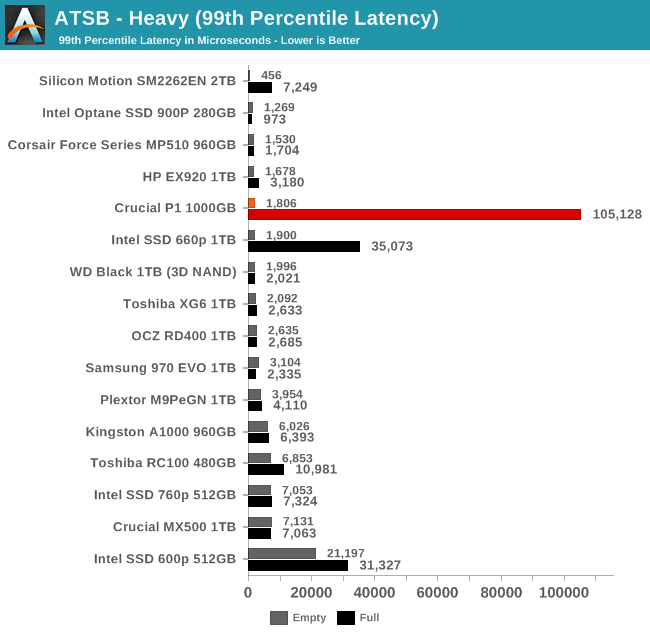
The empty-drive run of the Heavy test doesn't push the latency of the Crucial P1 up any higher than is typical for high-end NVMe drives. Things get more interesting on the full-drive test run, where the average latency from the P1 increases by a factor of 12 and the 99th percentile latency increases by a factor of 58. The average latency from the P1 is only slightly worse than the Intel 660p, but the 99th percentile score is three times that of the 660p.
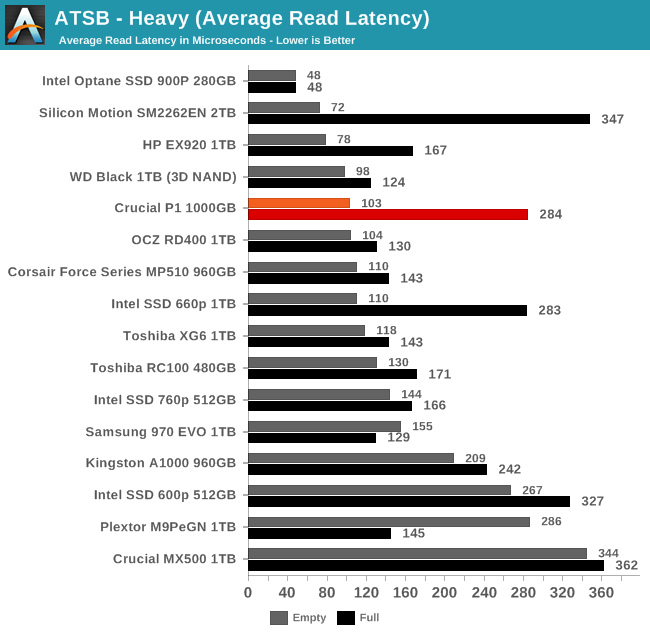
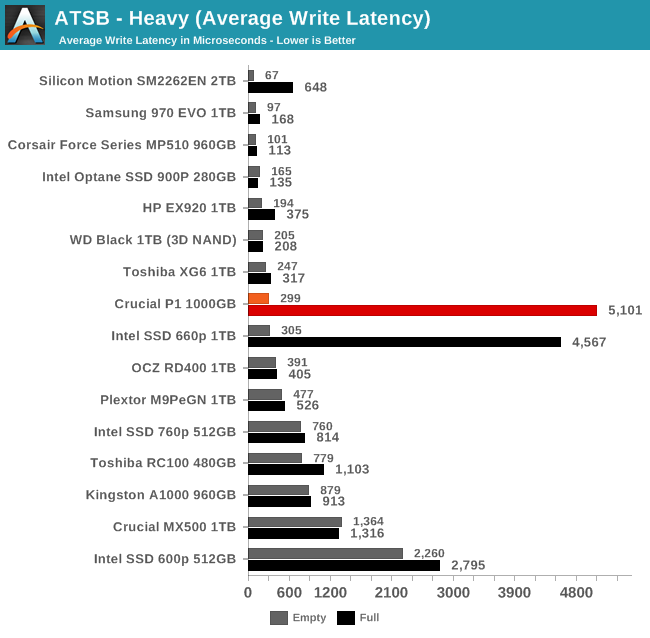
The average read latency of the Crucial P1 is significantly affected by whether the test is run on a full or empty drive, but even the worse of the two scores is still clearly better than what the Crucial MX500 manages. On the write side of thing, filling the drive has an almost catastrophic effect on latency, driving the average up by a factor of 17, an even more severe impact than the Intel 660p shows.
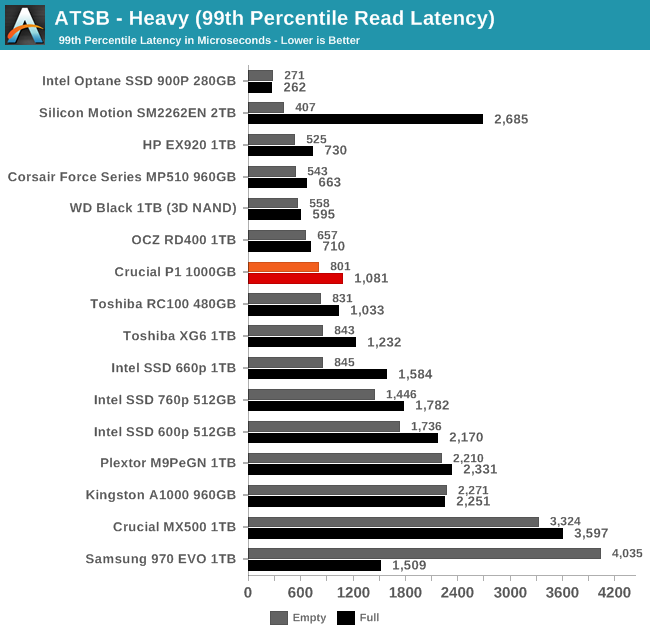
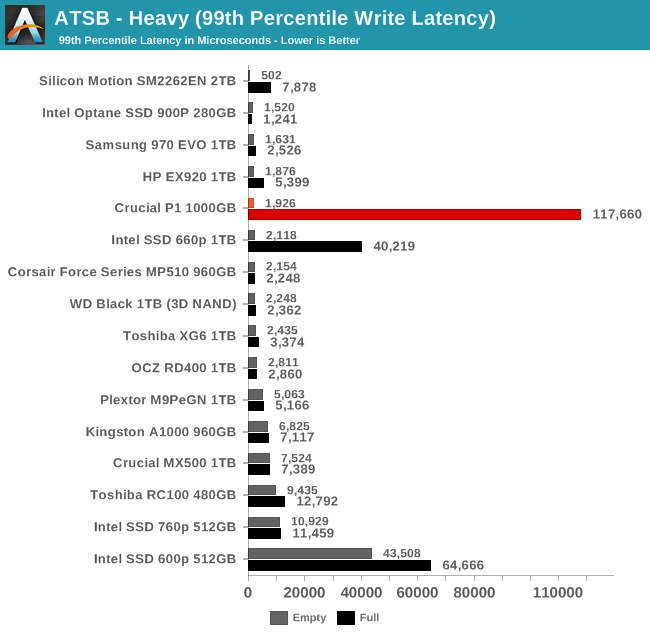
The 99th percentile read latency from the Crucial P1 is typical for high-end NVMe SSDs for both the full and empty drive test runs. The high overall 99th percentile latency is due entirely to the write portion, where filling the drive increases 99th percentile write latency by almost two orders of magnitude.
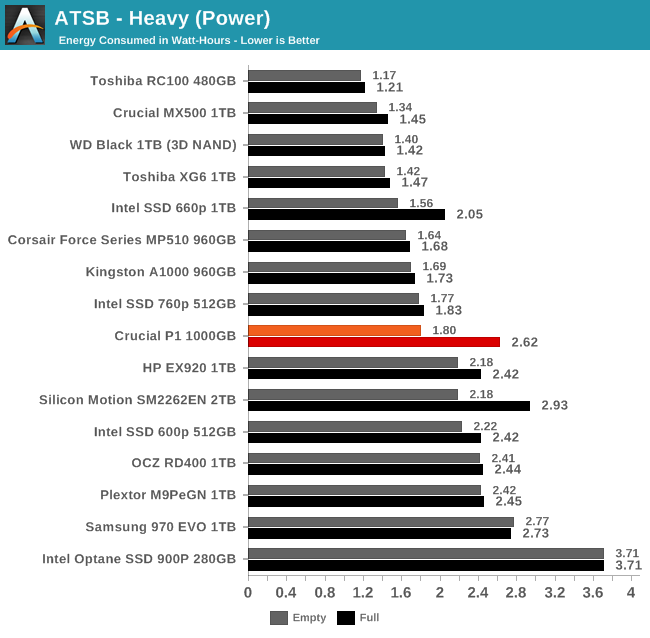
The total energy consumption of the Crucial P1 during the Heavy test is significantly higher than for the Intel 660p, and the difference between the empty and full drive test runs is larger for the P1 than for any other drive.
AnandTech Storage Bench - Light
Our Light storage test has relatively more sequential accesses and lower queue depths than The Destroyer or the Heavy test, and it's by far the shortest test overall. It's based largely on applications that aren't highly dependent on storage performance, so this is a test more of application launch times and file load times. This test can be seen as the sum of all the little delays in daily usage, but with the idle times trimmed to 25ms it takes less than half an hour to run. Details of the Light test can be found here. As with the ATSB Heavy test, this test is run with the drive both freshly erased and empty, and after filling the drive with sequential writes.
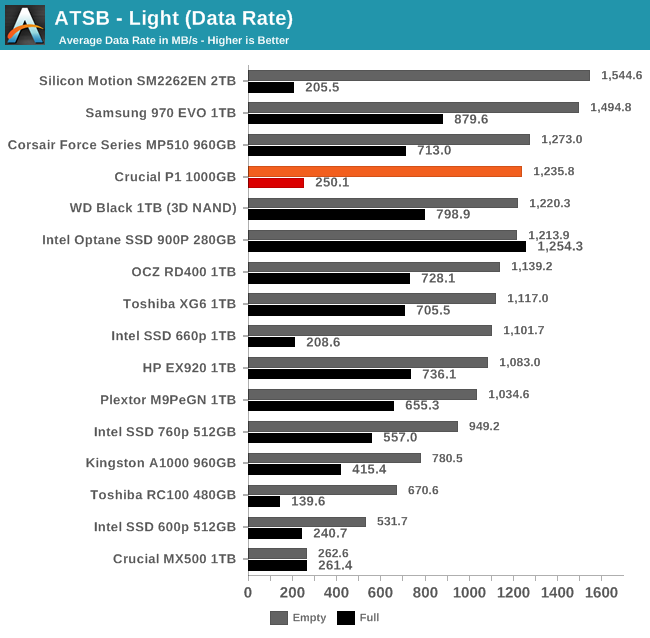
As with the Heavy test, the Crucial P1 handles the Light test as well as most high-end drives when the test is run on an empty drive with plenty of free space in the SLC cache. When the test is run on a full drive, the P1's average data rate drops to just below that of the Crucial MX500 SATA SSD.
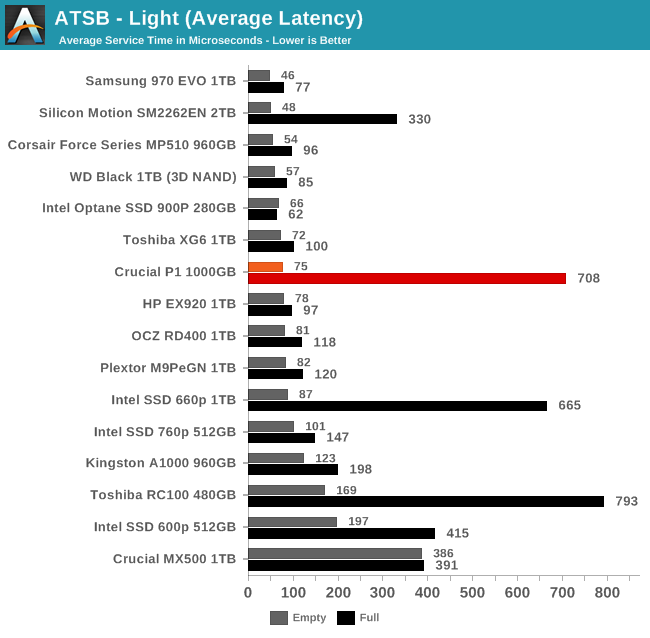
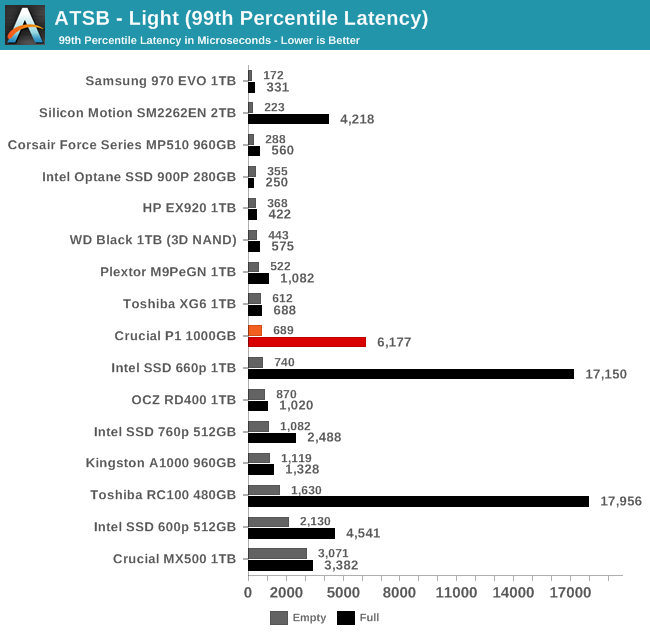
When the Light test is run on an empty Crucial P1, the average and 99th percentile latency scores are comparable to high-end NVMe SSDs because the test is operating entirely within the SLC cache. When that cache is shrunk by completely filling the drive, both latency scores are an order of magnitude worse. However, the 99th percentile latency is much better than what we saw from the Intel 660p when full.
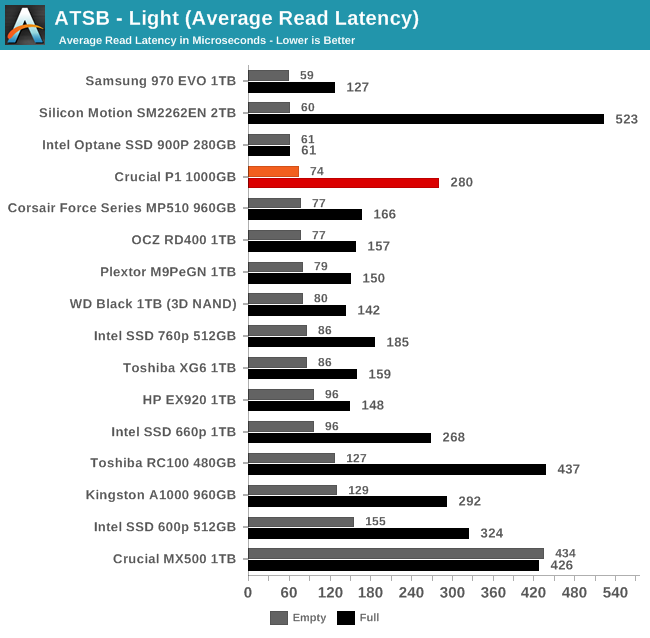
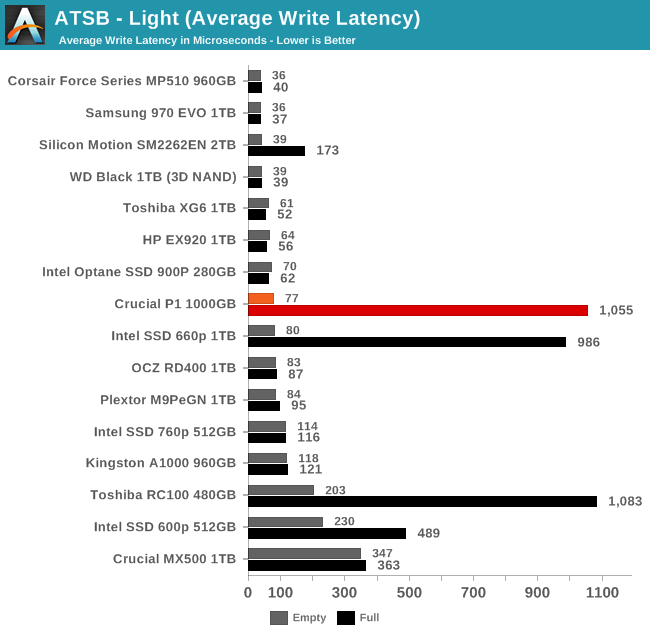
The average read latency of the Crucial P1 stays reasonably below that of SATA SSDs even when the test is run on a full drive, but the average write latency ends up several times higher than the MX500 SATA drive. The Intel 660p and DRAMless Toshiba RC100 have similar average write latency when full.
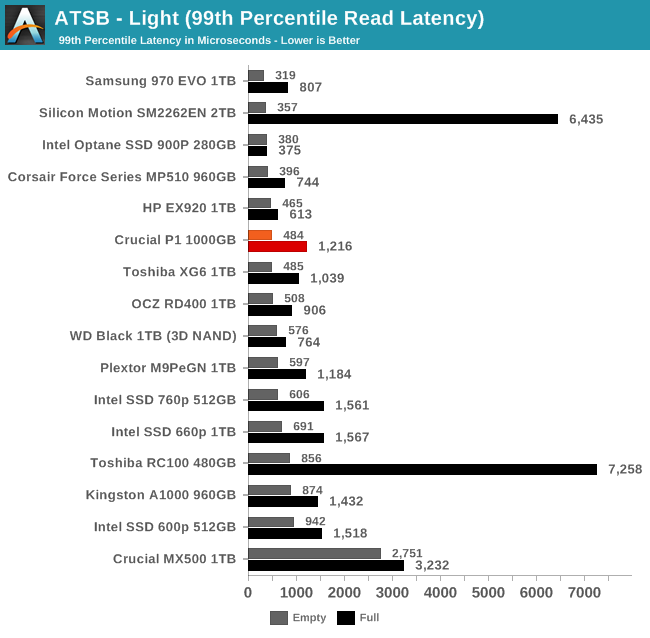
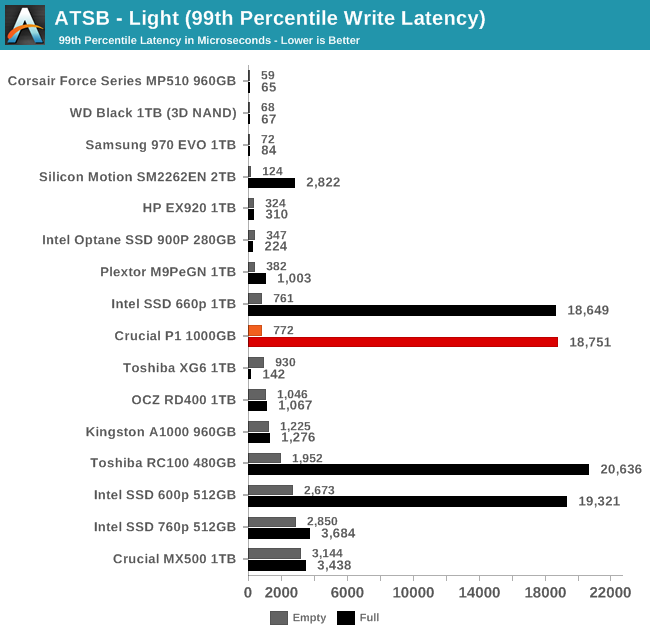
The 99th percentile read and write latency scores tell a similar story to the average latencies, but the weaknesses of the Crucial P1 stand out more clearly. Even with a full drive, read latency on the Light test isn't a problem, but write latency can climb to tens of milliseconds.
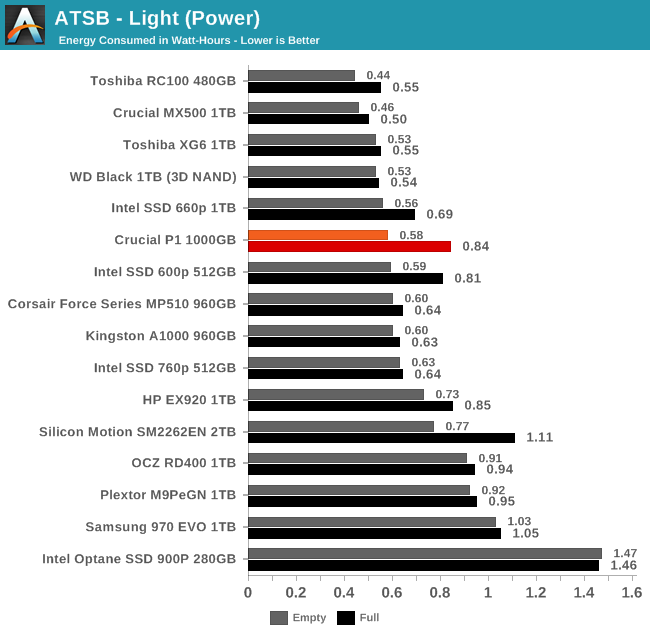
Energy usage by the Crucial P1 is reasonably low (by NVMe standards) when the Light test is run on an empty drive. When the test is run on a full drive, the P1 uses substantially more energy than the Intel 660p and instead shows comparable efficiency to most high-performance NVMe SSD.
BAPCo SYSmark 2018
BAPCo's SYSmark 2018 is an application-based benchmark that uses real-world applications to replay usage patterns of business users, with subscores for productivity, creativity and responsiveness. Scores represnt overall system performance and are calibrated against a reference system that is defined to score 1000 in each of the scenarios. A score of, say, 2000, would imply that the system under test is twice as fast as the reference system.
SYSmark scores are based on total application response time as seen by the user, including not only storage latency but time spent by the processor. This means there's a limit to how much a storage improvement could possibly increase scores, because the SSD is only in use for a small fraction of the total test duration. This is a significant difference from our ATSB tests where only the storage portion of the workload is replicated and disk idle times are cut short to a maximum of 25ms.
| AnandTech SYSmark SSD Testbed | |
| CPU | Intel Core i5-7400 |
| Motherboard | ASUS PRIME Z270-A |
| Chipset | Intel Z270 |
| Memory | 2x 8GB Corsair Vengeance DDR4-2400 CL17 |
| Case | In Win C583 |
| Power Supply | Cooler Master G550M |
| OS | Windows 10 64-bit, version 1803 |
Our SSD testing with SYSmark uses a different test system than the rest of our SSD tests. This machine is set up to measure total system power consumption rather than just the drive's power. The test is run five times in a row on each hardware configuration, and the average scores are reported below.
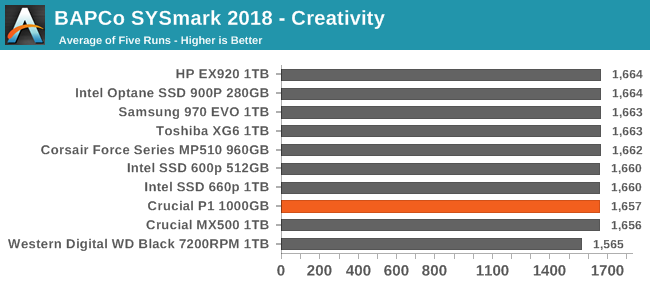
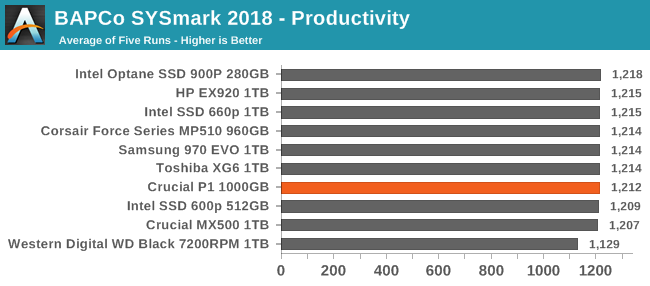
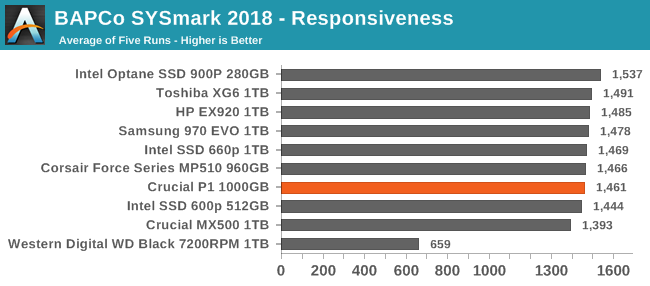
The creativity and productivity scenarios are relatively unaffected by storage performance, and depend much more on compute power. The responsiveness scores are more dependent on storage performance, but even so the differences between SSDs are fairly small. The Crucial P1 is outperforms the MX500 SATA drive but is a bit slower than the high-end NVMe drives.
Energy Usage
The SYSmark energy usage scores measure total system power consumption, excluding the display. Our SYSmark test system idles at around 26 W and peaks at over 60 W measured at the wall during the benchmark run. SATA SSDs seldom exceed 5 W and idle at a fraction of a watt, and the SSDs spend most of the test idle. This means the energy usage scores will inevitably be very close. A typical notebook system will tend to be better optimized for power efficiency than this desktop system, so the SSD would account for a much larger portion of the total and the score difference between SSDs would be more noticeable.
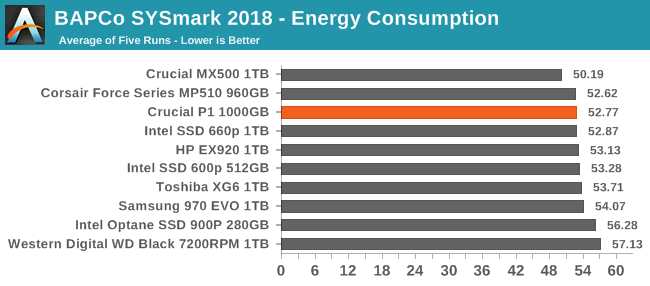
The energy consumption scores for the SSDs reflect the general trend that higher performance comes with the cost of worse power efficiency. SATA SSDs still lead the rankings for most efficient drive, and the hard drive that's included for comparison purposes required more energy than even the power-hungry Intel Optane SSD 900P.
Random Read Performance
Our first test of random read performance uses very short bursts of operations issued one at a time with no queuing. The drives are given enough idle time between bursts to yield an overall duty cycle of 20%, so thermal throttling is impossible. Each burst consists of a total of 32MB of 4kB random reads, from a 16GB span of the disk. The total data read is 1GB.
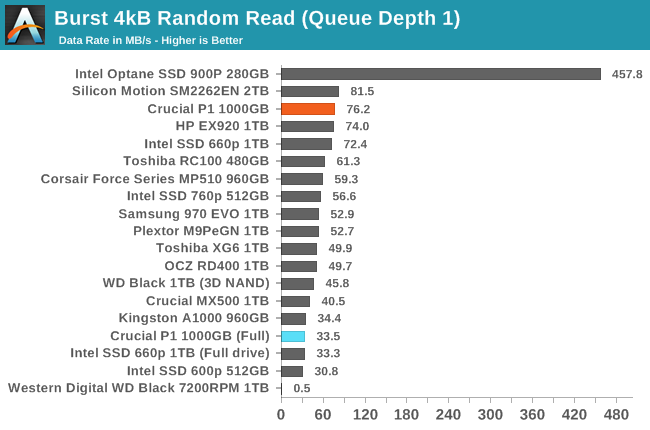
When the Crucial P1 has plenty of unused capacity and its SLC cache is large enough to contain the entire 16GB of test data, the burst random read performance is excellent. When the drive is full and the test data can no longer fit in the SLC cache, the performance falls behind the Crucial MX500 and most low-end NVMe SSDs.
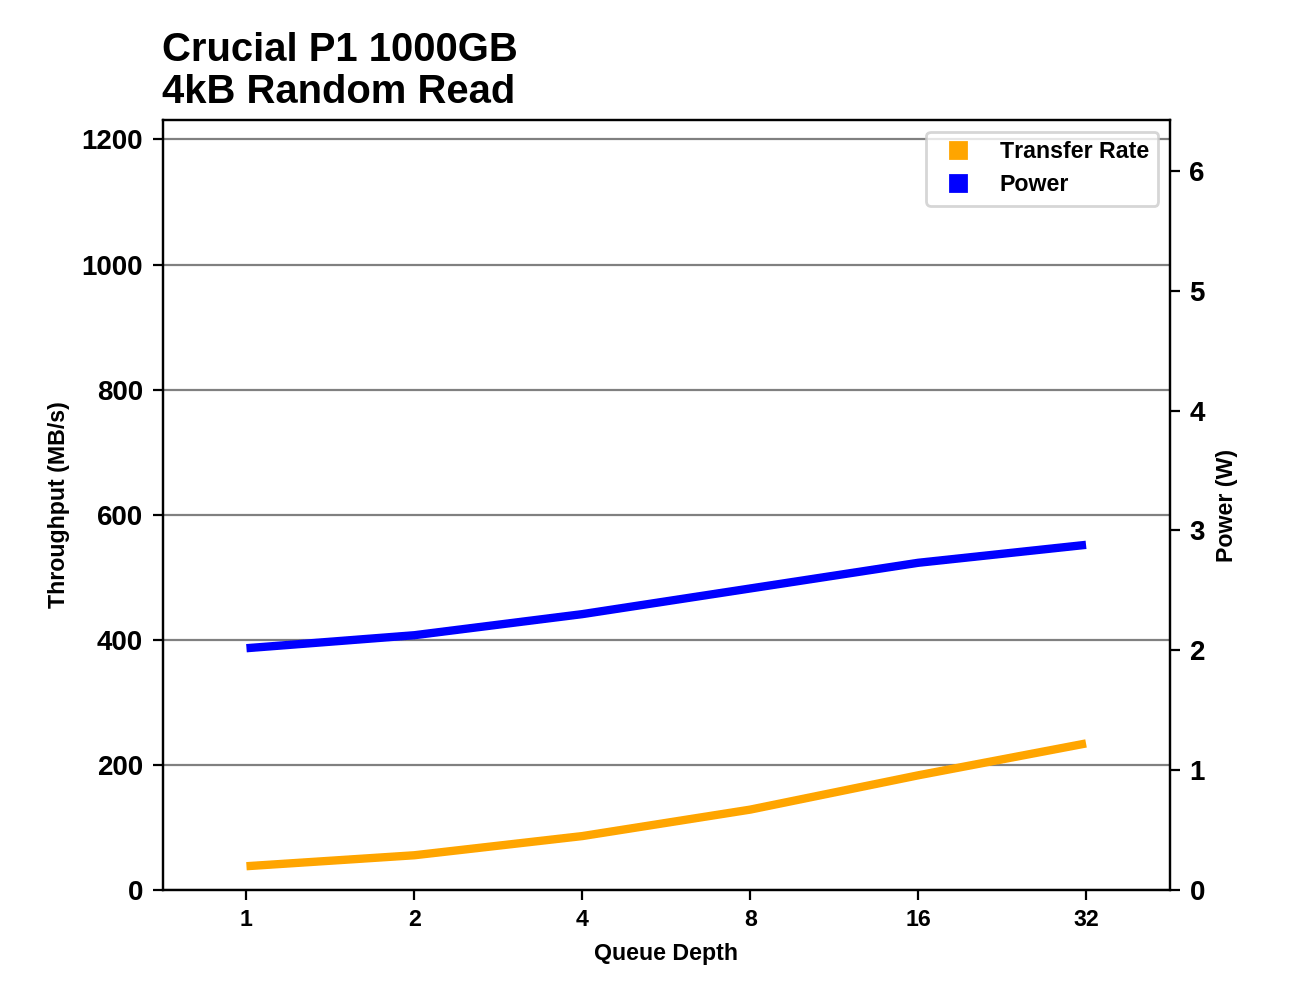
Our sustained random read performance is similar to the random read test from our 2015 test suite: queue depths from 1 to 32 are tested, and the average performance and power efficiency across QD1, QD2 and QD4 are reported as the primary scores. Each queue depth is tested for one minute or 32GB of data transferred, whichever is shorter. After each queue depth is tested, the drive is given up to one minute to cool off so that the higher queue depths are unlikely to be affected by accumulated heat build-up. The individual read operations are again 4kB, and cover a 64GB span of the drive.
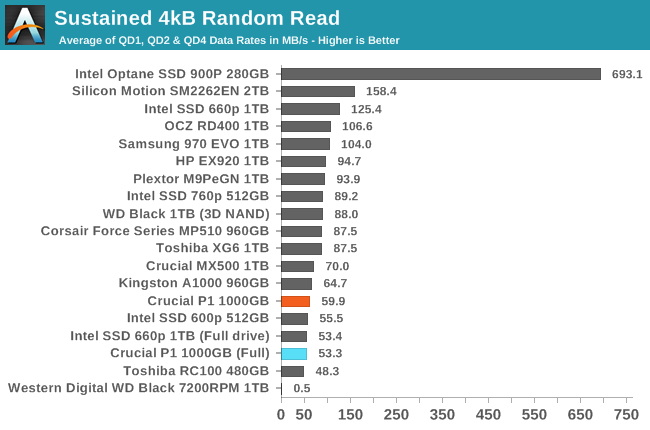
The sustained random read performance of the Crucial P1 at low queue depths is mediocre at best, falling behind most TLC-based NVMe SSDs and the Crucial MX500. By contrast, the Intel 660p manages to retain its high performance even on the sustained test, indicating that the Intel drive kept more of the test data in its SLC cache than the Crucial P1 does. When the test is run on a full drive, the P1 and the 660p have equivalent performance that is about 12% slower than the P1 with only the 64GB test data file.
 |
|||||||||
| Power Efficiency in MB/s/W | Average Power in W | ||||||||
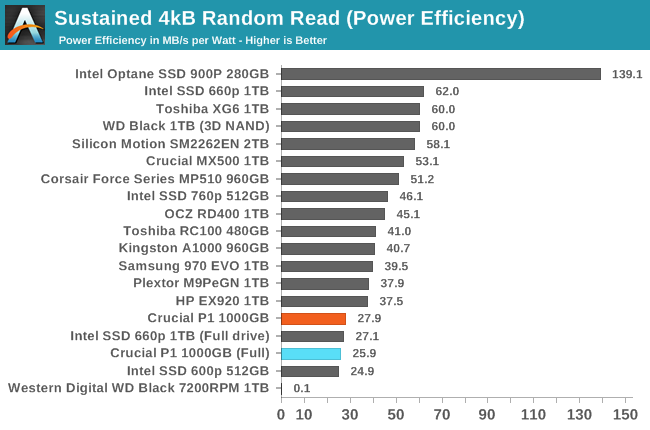
The power efficiency of the Crucial P1 during the sustained random read test is less than half of what the Intel 660p offers, due almost entirely to the large performance difference. At just over 2W, the power consumption of the P1 is reasonable, but it doesn't provide the performance to match when the test data isn't in the SLC cache.
 |
|||||||||
The random read performance of the Crucial P1 increases modestly with higher queue depths, but it pales in comparison to what the Intel 660p delivers by serving most of the reads for this test out of its SLC cache. Even the Crucial MX500 develops a large lead over the P1 at the highest queue depths, while using less power.
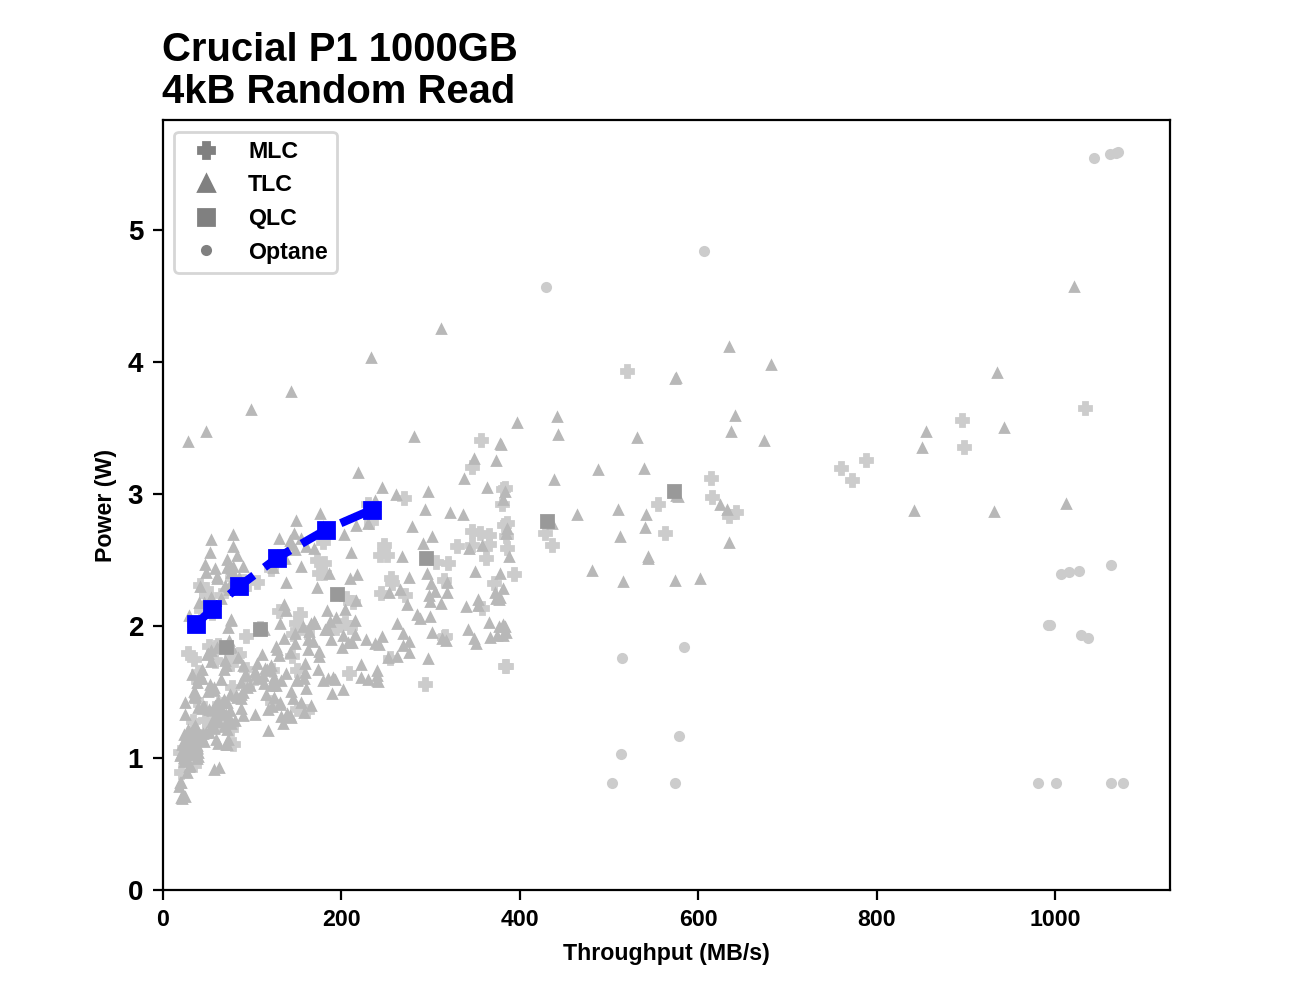
Plotting the sustained random read performance and power consumption of the Crucial P1 against the rest of the drives that have run through our 2018 SSD test suite, it is clear that the drive doesn't measure up well against even most SATA SSDs, let alone NVMe drives that go beyond the SATA speed limit when given a sufficiently high queue depth. Thanks to its SLC cache being more suited to these test conditions, the Intel 660p is among those NVMe drives that beat the limits of SATA.
Random Write Performance
Our test of random write burst performance is structured similarly to the random read burst test, but each burst is only 4MB and the total test length is 128MB. The 4kB random write operations are distributed over a 16GB span of the drive, and the operations are issued one at a time with no queuing.
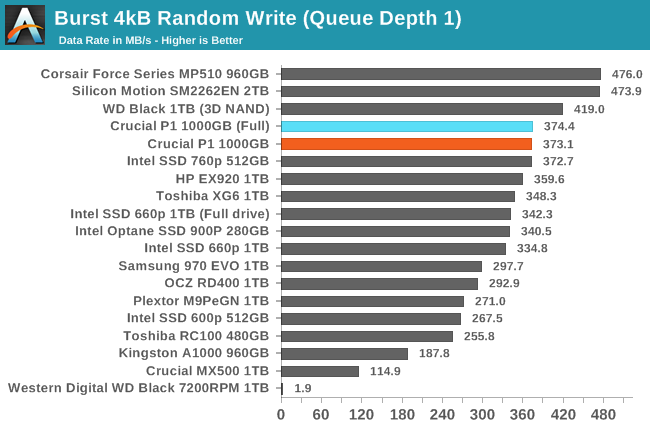
The burst random write performance of the Crucial P1 is good, but not quite on par with the top tier of NVMe SSDs. The Intel 660p is about 10% slower. Both drives clearly have enough free SLC cache to handle this test even when the drives are completely full.
As with the sustained random read test, our sustained 4kB random write test runs for up to one minute or 32GB per queue depth, covering a 64GB span of the drive and giving the drive up to 1 minute of idle time between queue depths to allow for write caches to be flushed and for the drive to cool down.
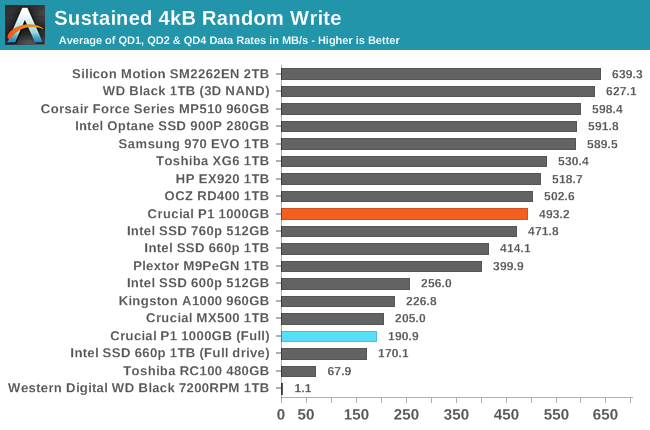
The longer sustained random write test involves enough data to show the effects of the variable SLC cache size on the Crucial P1: performance on a full drive is less than half of what the drive provides when it only contains the 64GB test data. As with the burst random write test, the P1 has a small but clear performance advantage over the Intel 660p.
 |
|||||||||
| Power Efficiency in MB/s/W | Average Power in W | ||||||||
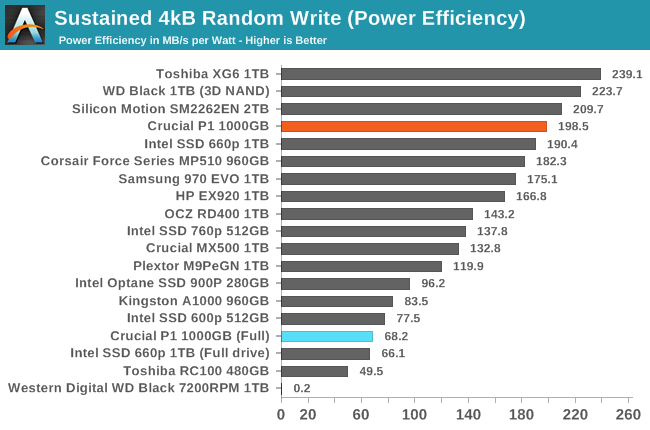
When the sustained random write test is run on the Crucial P1 containing only the test data, it delivers excellent power efficiency. When the drive is full and the SLC cache is inadequate, power consumption increases slightly and efficiency is reduced by almost a factor of three.
 |
|||||||||
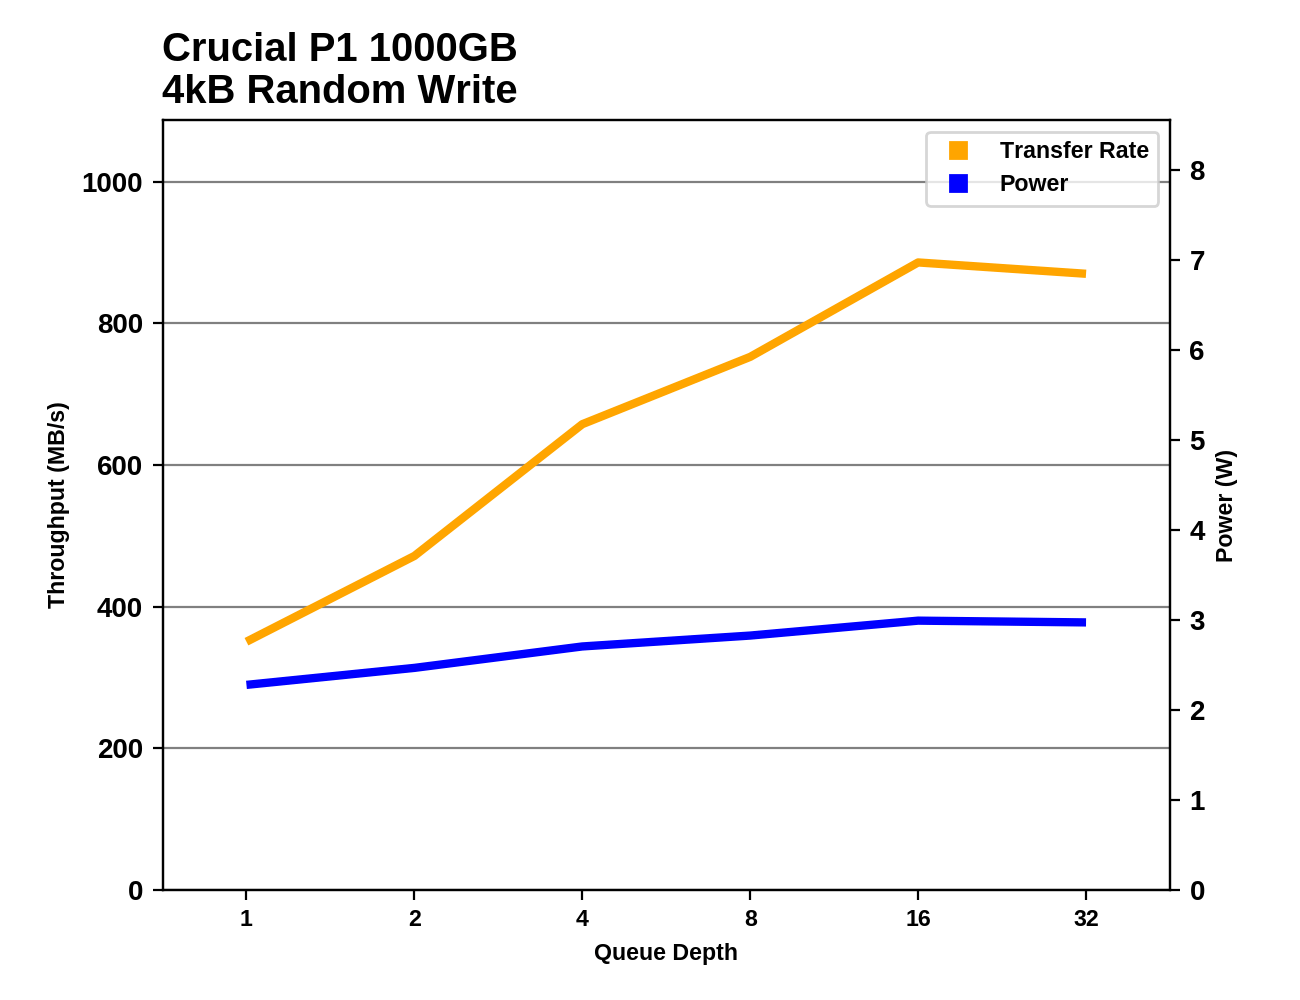
Even when the random write test is conducted on an otherwise empty Crucial P1, the SLC cache starts to fill up by the time the queue depth reaches 32. When the drive is full and the cache is at its minimum size, random write performance decreases with each phase of the test despite the increasing queue depth. By contrast, the Intel 660p shows signs of its SLC cache filling up after QD4 even when the drive is otherwise empty, but its full-drive performance is steadier.
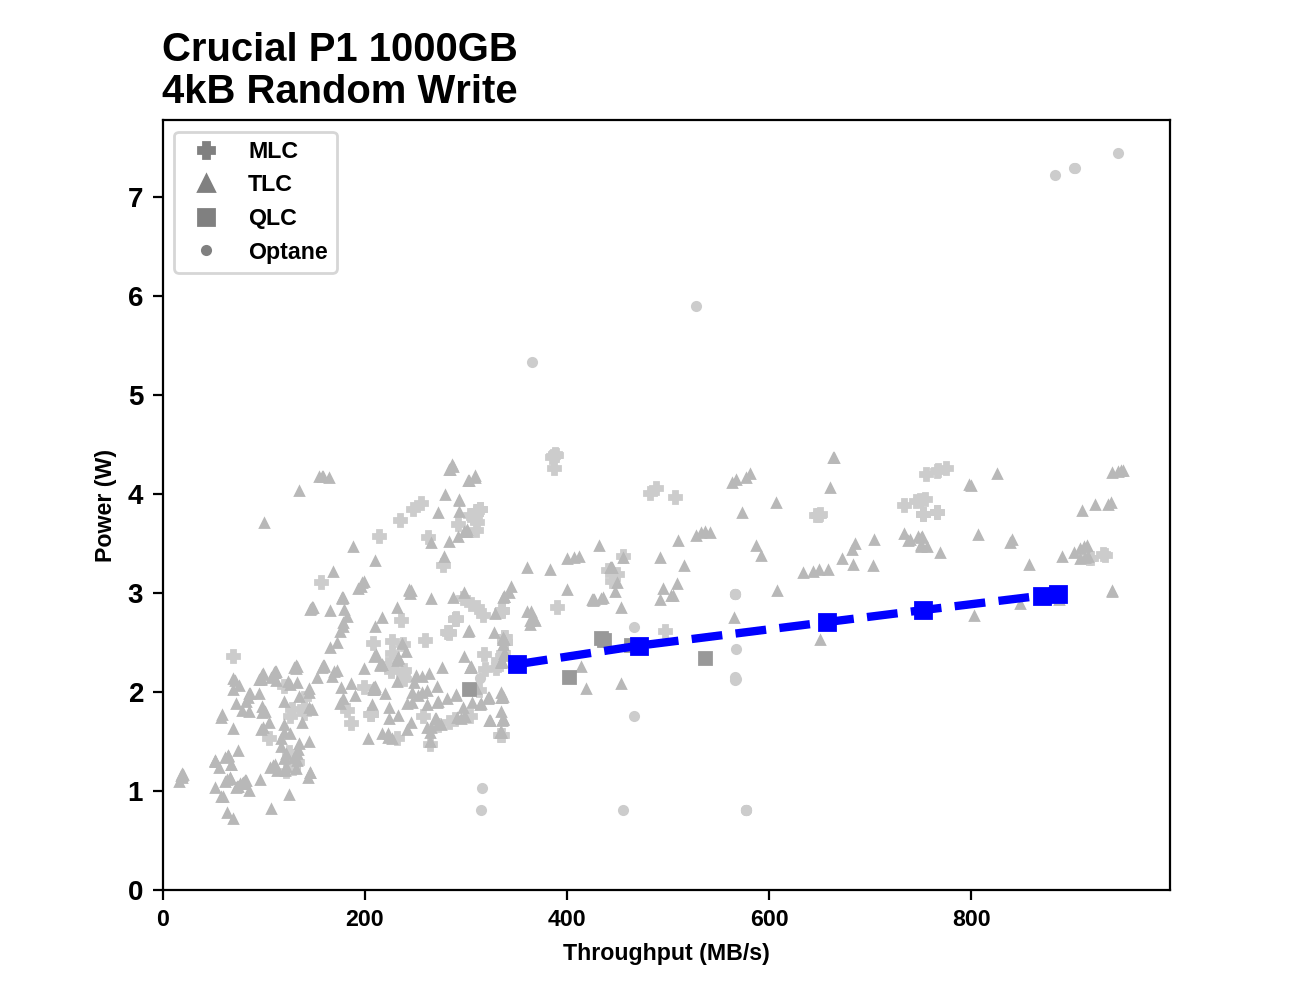
Plotting the Crucial P1's sustained random write performance and power consumption against the rest of the drives that have completed our 2018 SSD test suite emphasizes the excellent combination of performance and power efficiency enabled by the very effective SLC write cache. The P1 requires more power than many SATA drives, but almost all NVMe drives require more power to deliver the same performance, and the very fastest drives aren't much faster than the peak write speed of the Crucial P1.
Sequential Read Performance
Our first test of sequential read performance uses short bursts of 128MB, issued as 128kB operations with no queuing. The test averages performance across eight bursts for a total of 1GB of data transferred from a drive containing 16GB of data. Between each burst the drive is given enough idle time to keep the overall duty cycle at 20%.
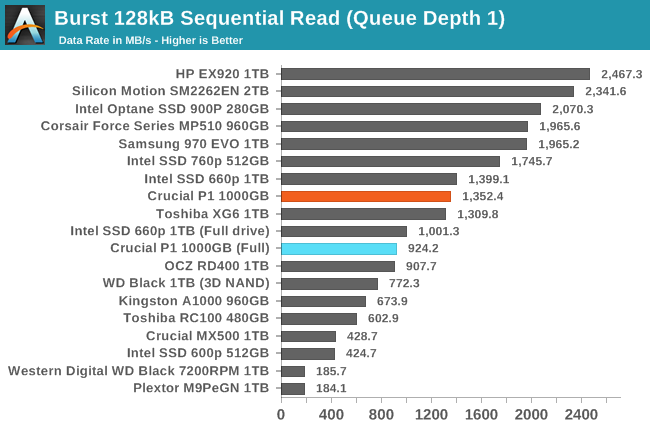
The burst sequential read performance of the Crucial P1 is decent for an entry-level NVMe SSD. Even when the test is run on a full drive, the P1 is about twice as fast as a SATA SSD. The Intel 660p is slightly faster on this test, with more of an advantage in the full-drive/small SLC cache conditions.
Our test of sustained sequential reads uses queue depths from 1 to 32, with the performance and power scores computed as the average of QD1, QD2 and QD4. Each queue depth is tested for up to one minute or 32GB transferred, from a drive containing 64GB of data. This test is run twice: once with the drive prepared by sequentially writing the test data, and again after the random write test has mixed things up, causing fragmentation inside the SSD that isn't visible to the OS. These two scores represent the two extremes of how the drive would perform under real-world usage, where wear leveling and modifications to some existing data will create some internal fragmentation that degrades performance, but usually not to the extent shown here.
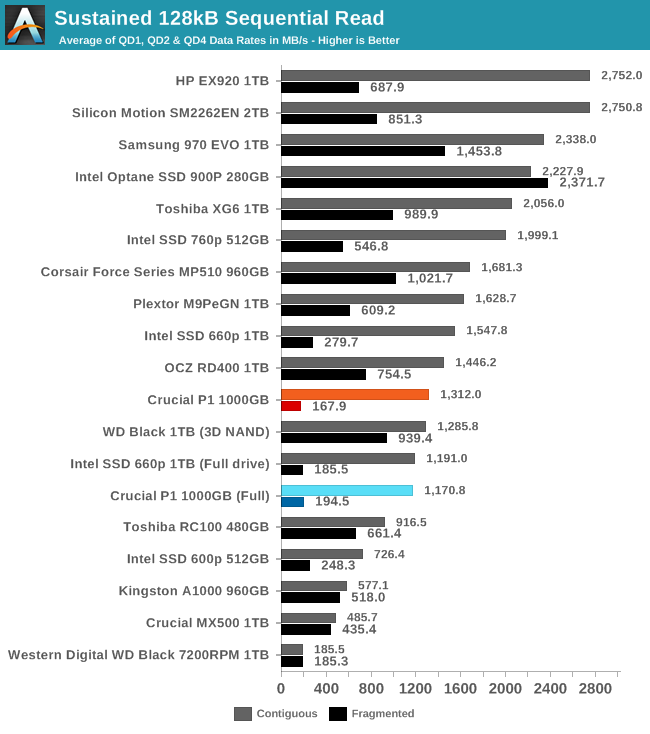
On the longer sequential read test, the Crucial P1 sustains sequential reads at over 1GB/s even when full, so long as the data is contiguous on the flash itself due to having been written sequentially. When reading data that has been modified heavily by random writes, the drive has to do random reads behind the scenes and its performance is no longer competitive with other current NVMe SSDs or even mainstream SATA SSDs, though it does at least maintain roughly the same level of performance that can be expected from a hard drive (which doesn't need wear leveling and thus is not subject to internal fragmentation). As with the burst sequential read test, the Intel 660p is slightly faster.
 |
|||||||||
| Power Efficiency in MB/s/W | Average Power in W | ||||||||
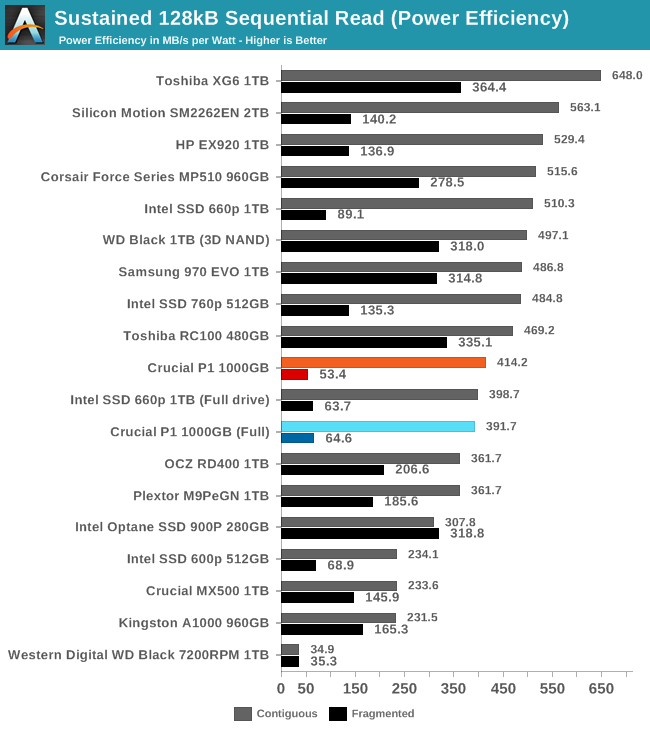
The power efficiency of the Crucial P1 when reading contiguous data is reasonable for a NVMe drive but nothing special. When reading data with internal fragmentation, the power consumption is the same but the reduced performance drags the efficiency way down, to only 50% better than a 3.5" hard drive.
 |
|||||||||
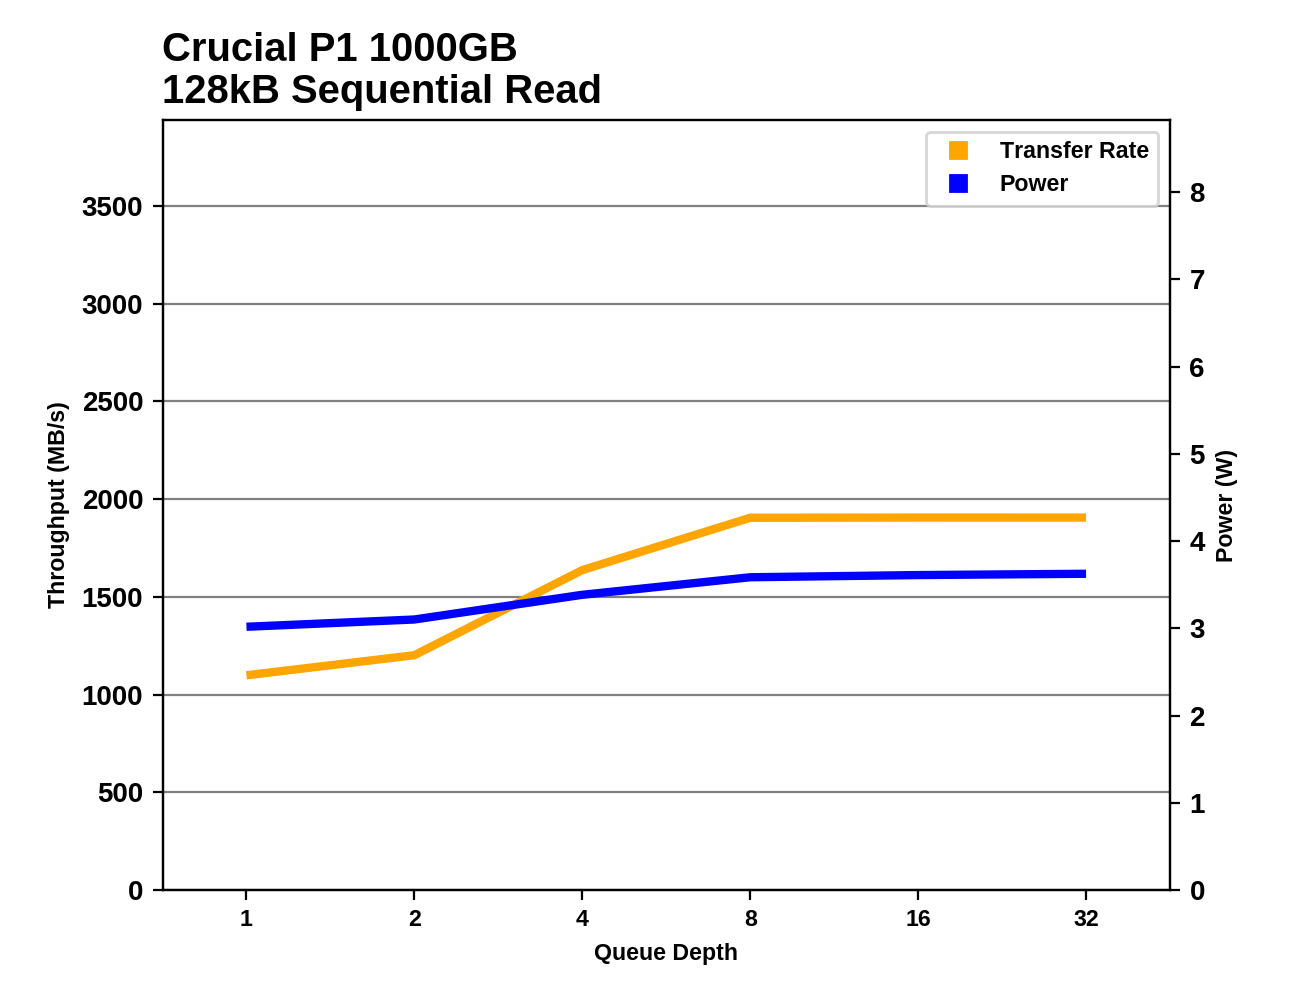
The Crucial P1 reaches full sequential read speed of just under 2GB/s at QD8 or higher. While the Intel 660p has the advantage at low queue depths, the P1 ends up slightly faster at higher queue depths.
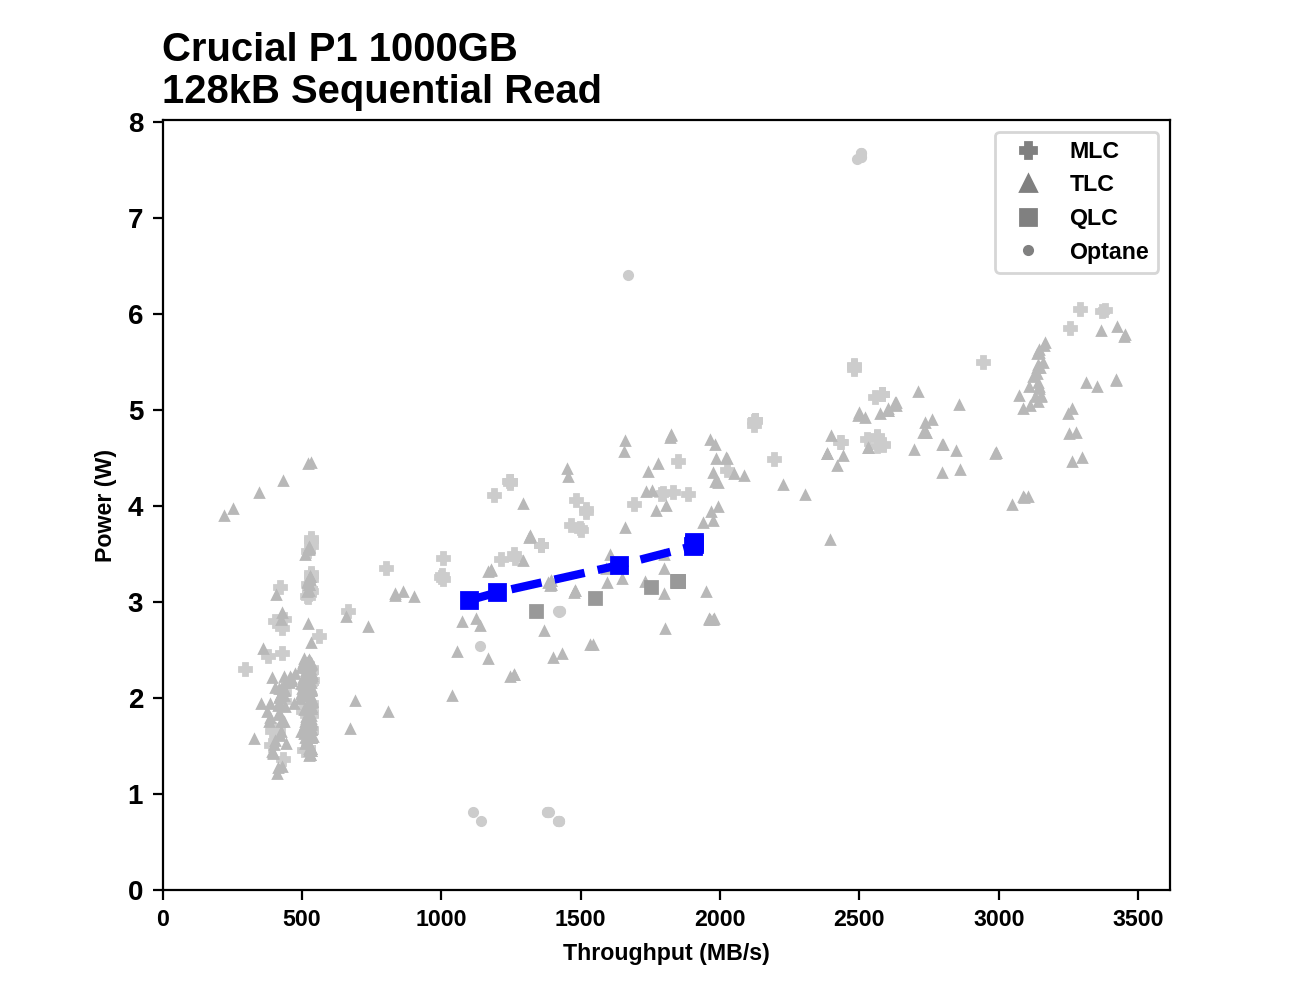
Looking at which part of the performance and power landscape the Crucial P1 occupies compared to all the other drives that have been subjected to our 2018 SSD tests, the P1 is very middle-of-the-road among NVMe drives for both performance and power consumption. There are drives with similar read performance profiles that require nearly 1W less, and high-performance drives that can deliver more than 1GB/s faster speeds than the P1 without using much more power than the P1 at its peak.
Sequential Write Performance
Our test of sequential write burst performance is structured identically to the sequential read burst performance test save for the direction of the data transfer. Each burst writes 128MB as 128kB operations issued at QD1, for a total of 1GB of data written to a drive containing 16GB of data.
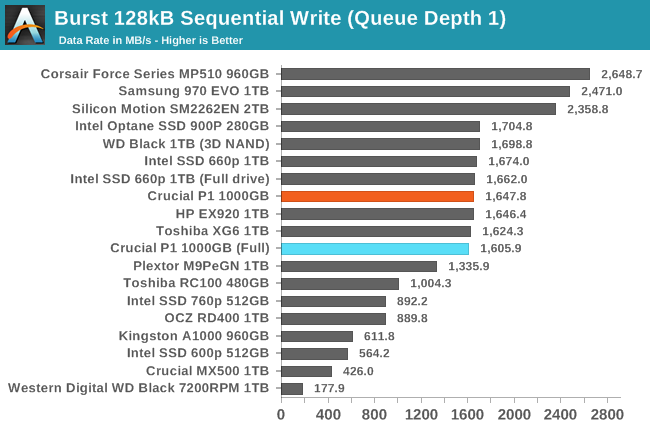
On the burst sequential write test, the Crucial P1 is on par with many high-end NVMe SSDs, thanks to the high write performance of its SLC cache. This test is short enough that the P1 doesn't overflow the SLC cache even when it is at its minimum size due to the drive being full.
Our test of sustained sequential writes is structured identically to our sustained sequential read test, save for the direction of the data transfers. Queue depths range from 1 to 32 and each queue depth is tested for up to one minute or 32GB, followed by up to one minute of idle time for the drive to cool off and perform garbage collection. The test is confined to a 64GB span of the drive.
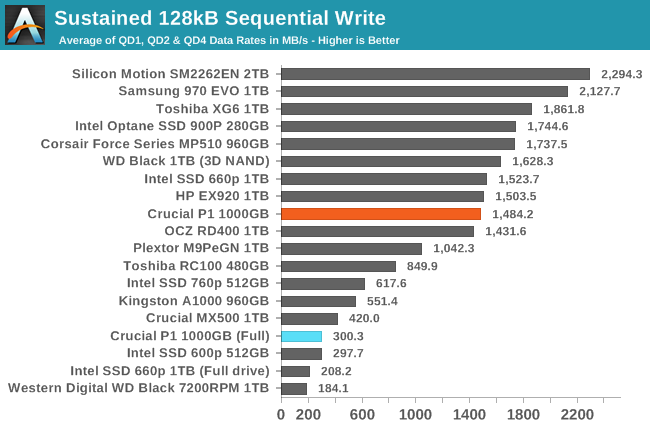
On the longer sequential write test, the Crucial P1 continues to perform well when the drive is mostly empty and the SLC cache is at its largest. When the drive is full, this test writes enough to overflow the cache and performance drops below that of mainstream SATA SSDs.
 |
|||||||||
| Power Efficiency in MB/s/W | Average Power in W | ||||||||
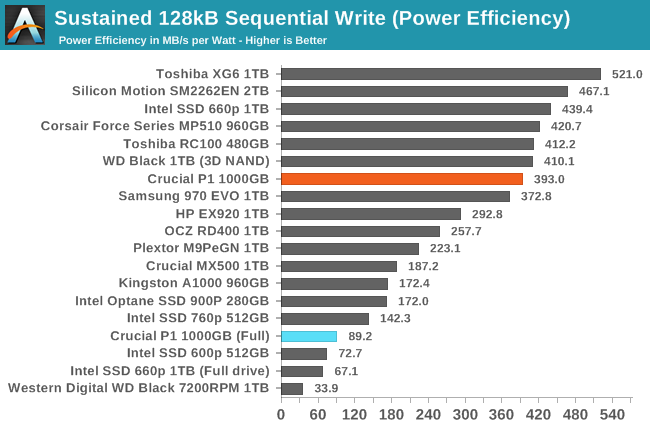
Power consumption by the Crucial P1 during the sustained sequential write test is lower than average for NVMe SSDs, so the efficiency is good when the test hits only the SLC cache. When the drive is full and the SLC cache overflows, the P1's efficiency is significantly worse than almost all of the competition, though the performance per Watt is still several times what a hard drive can manage.
 |
|||||||||
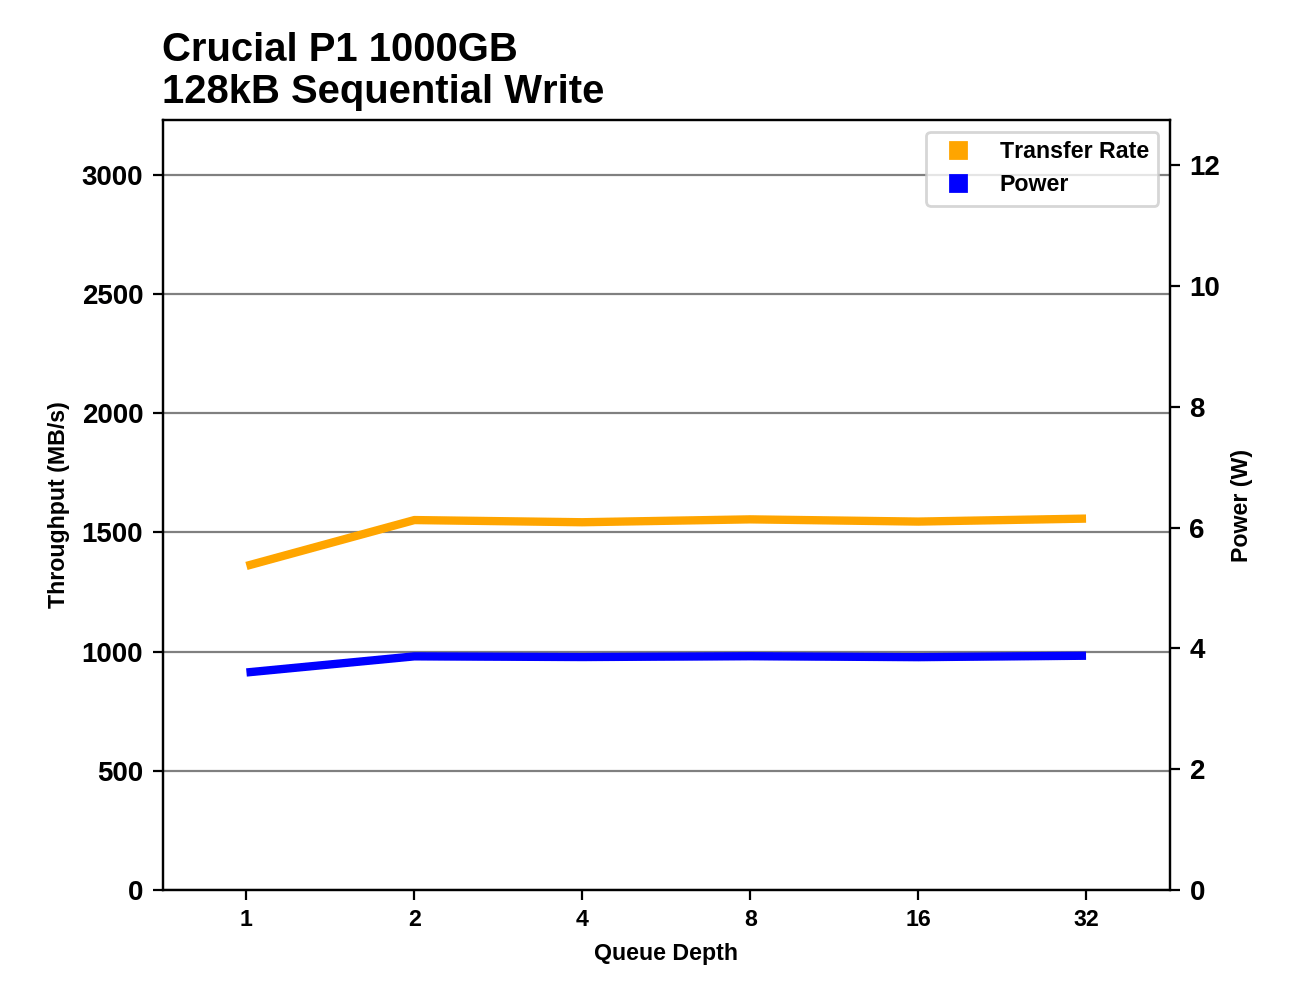
The Crucial P1 hits its full write speed at a queue depth of 2 or higher, when writing to the SLC cache. When the drive is full, the SLC cache overflows before the QD1 test phase is over, and performance bounces around a bit but stays generally quite low with each phase of the test. The Intel 660p is slightly faster when writing to its SLC cache, and performs more consistently when the cache is constantly overflowing.
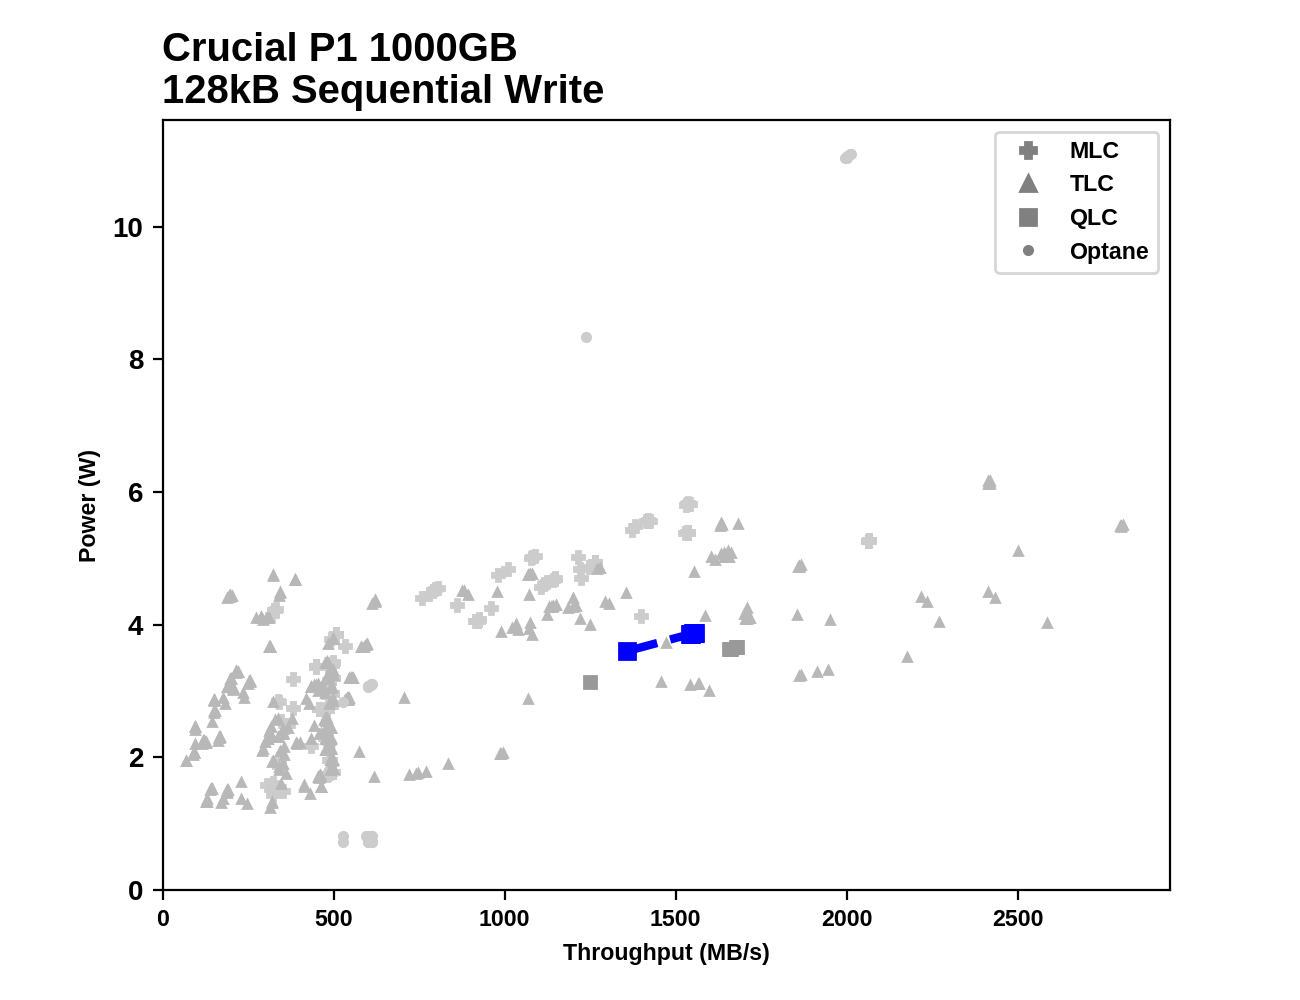
Compared against all the other drives that have completed our 2018 SSD test suite, the sequential write performance and power consumption of the Crucial P1 are better than most other low-end NVMe drives (or drives that would be considered low-end if they were still on the market). But there are numerous high-end drives that vastly outperform the P1, and some of them use a bit less power in doing so.
Whole-Drive Fill
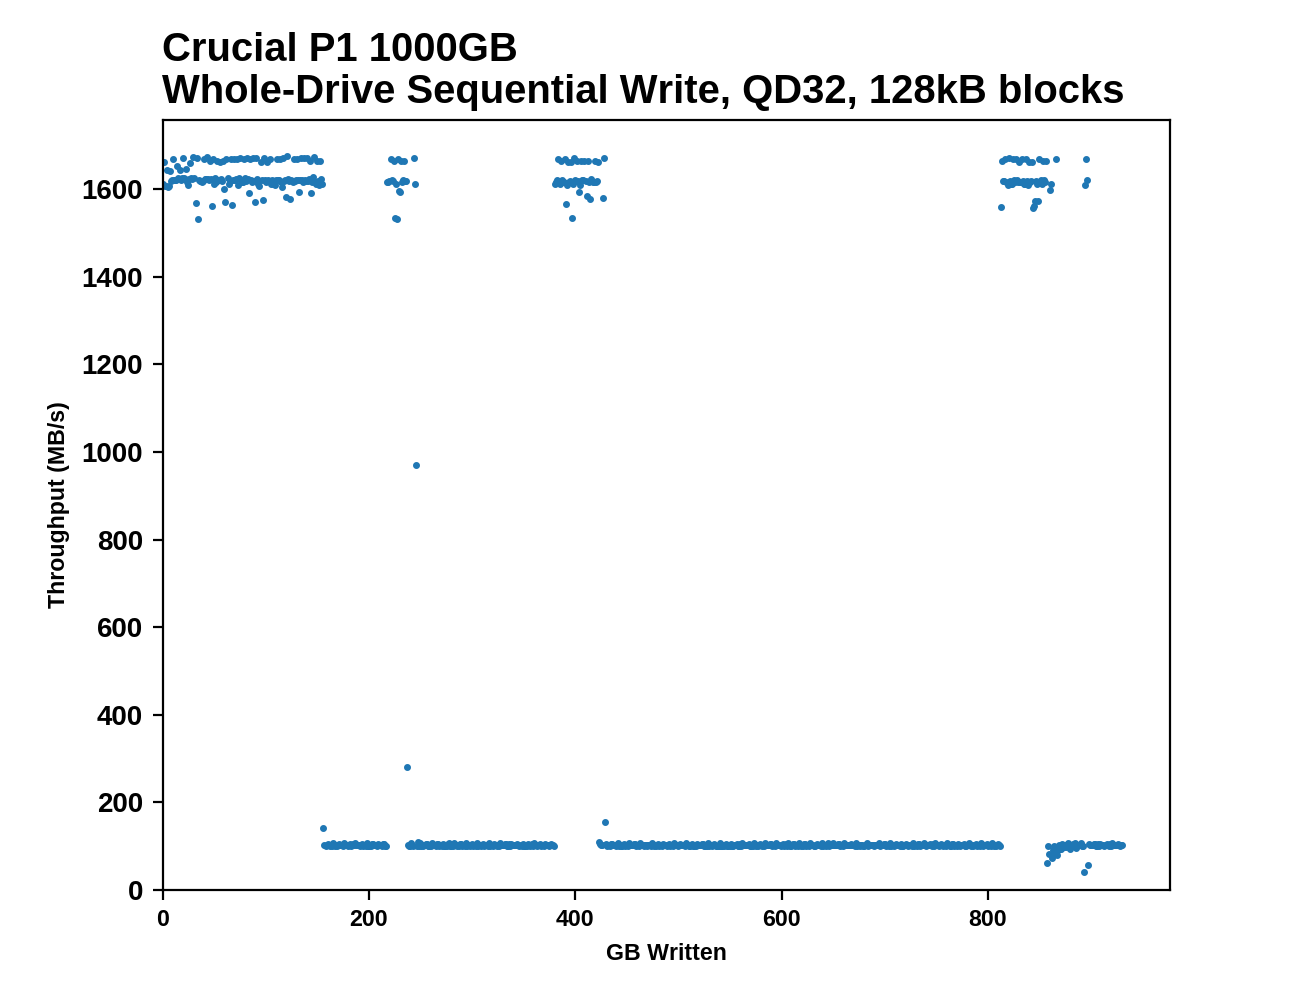
This test starts with a freshly-erased drive and fills it with 128kB sequential writes at queue depth 32, recording the write speed for each 1GB segment. This test is not representative of any ordinary client/consumer usage pattern, but it does allow us to observe transitions in the drive's behavior as it fills up. From this, we can estimate the size of any SLC write cache, and get a sense for how much performance remains on the rare occasions where real-world usage keeps writing data after filling the cache.
 |
|||||||||
The 1TB Crucial P1 manages about 155 GB of sequential writes before the SLC cache overflows and performance tanks. The drive does manage to free up some SLC cache on several occasions before the drive is completely full, so the write speed occasionally jumps back up. The Intel 660p only lasts for about 128 GB before its cache runs out, and while it does show some variability in write speed during the rest of the drive fill, it never gets all the way back up to the full SLC write speed.
 |
|||||||||
| Average Throughput for last 16 GB | Overall Average Throughput | ||||||||
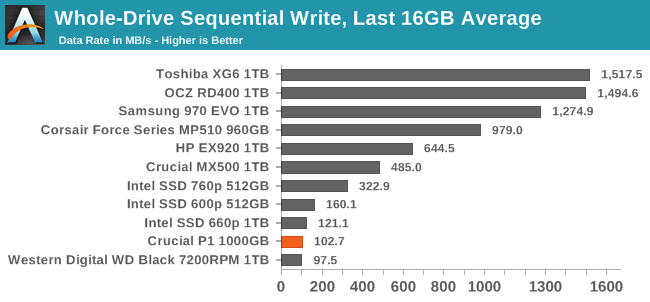
For extremely large sequential write operations that overflow the SLC cache, the Crucial P1 and Intel 660p average out to about the same speed as a 7200RPM hard drive. The fast writes to the SLC cache don't last long enough to bring the average up very far above the steady-state write speeds of about 100MB/s. High-end NVMe SSDs with modern 3D TLC NAND and 8-channel controllers can sustain write speeds that are about an order of magnitude higher after the SLC caches run out.
Mixed Random Performance
Our test of mixed random reads and writes covers mixes varying from pure reads to pure writes at 10% increments. Each mix is tested for up to 1 minute or 32GB of data transferred. The test is conducted with a queue depth of 4, and is limited to a 64GB span of the drive. In between each mix, the drive is given idle time of up to one minute so that the overall duty cycle is 50%.
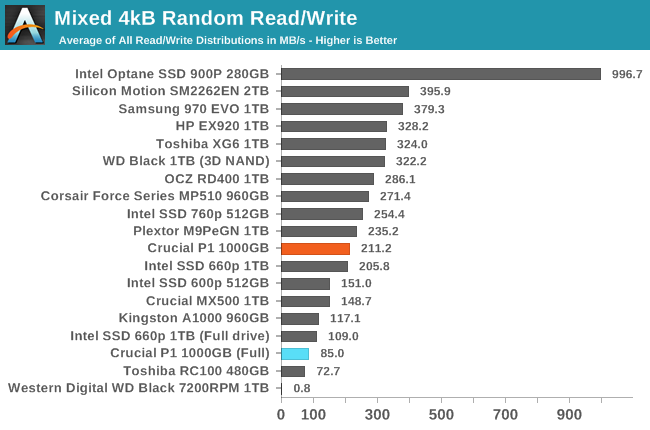
The Crucial P1 has reasonable entry-level NVMe performance on the mixed random I/O test. It's clearly faster than the MX500 SATA SSD and comes close to some high-end NVMe SSDs. But when the drive is full and the SLC cache is at its minimum size, the P1 slows down to 40% of its speed on a drive containing only the test data. When full, the P1 is about 22% slower than the Intel 660p, but their empty-drive performance is similar.
 |
|||||||||
| Power Efficiency in MB/s/W | Average Power in W | ||||||||
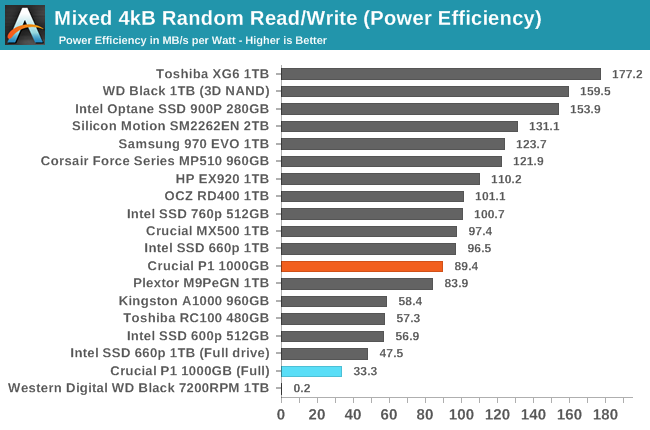
The Crucial P1 has worse power efficiency than the Intel 660p on this test, whether it is run on a full drive or not. The efficiency is still reasonable for the mostly-empty drive test run, but when full the P1's power consumption increases slightly and the efficiency is significantly worse than other low-end NVMe SSDs.
 |
|||||||||
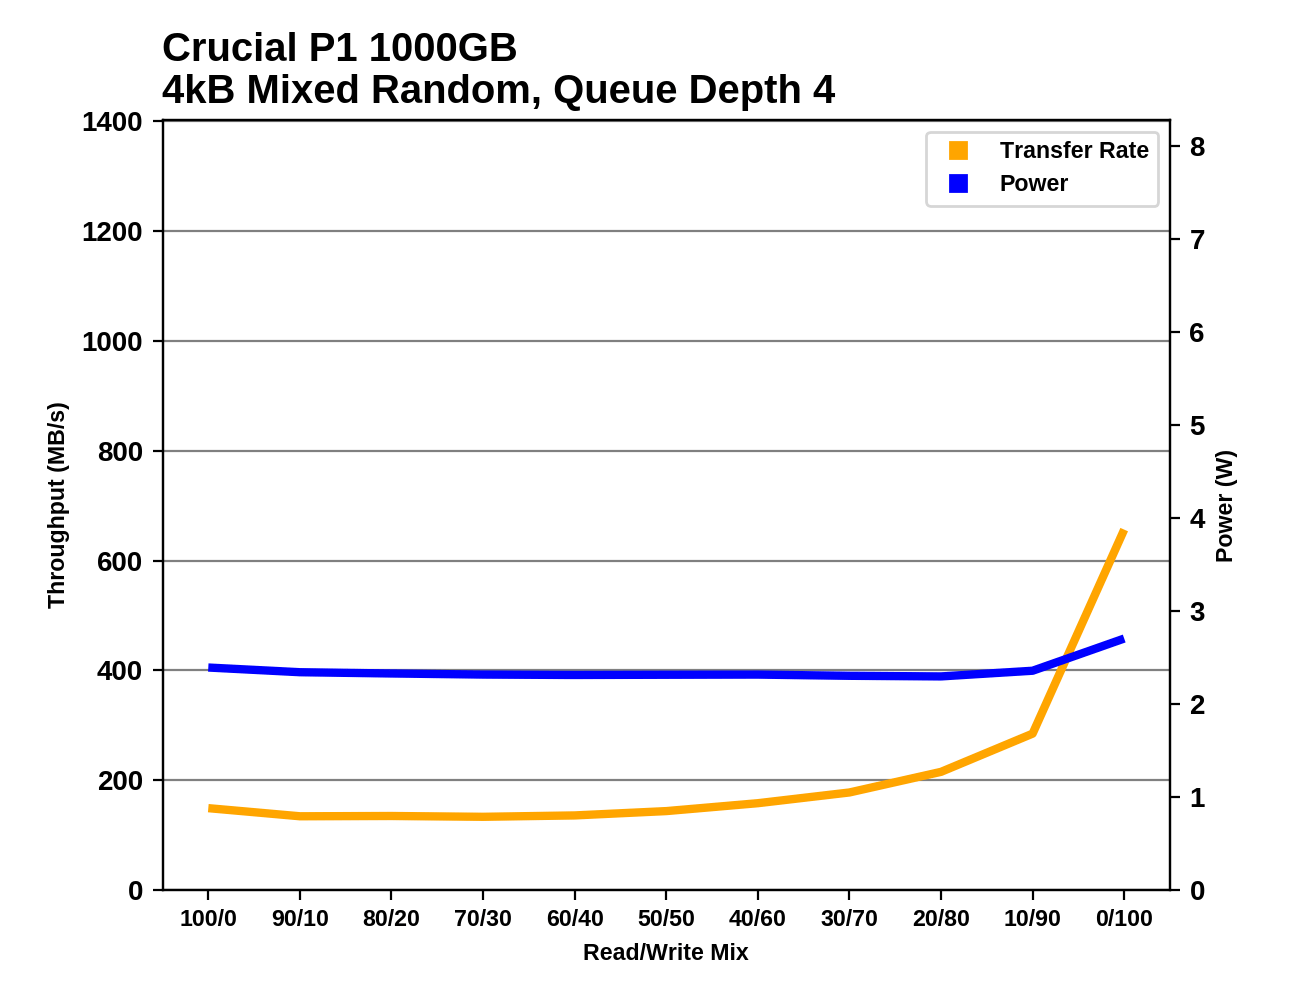
When the mixed random I/O test is run on a full Crucial P1, the benefits of the SLC cache almost completely disappear, leaving the drive with a mostly flat performance curve (with some inconsistency) rather than the significant performance upswing as the proportion of writes grows beyond 70%. The Intel 660p's performance is very similar save for slightly lower write performance to the SLC cache, and slightly improved full-drive performance.
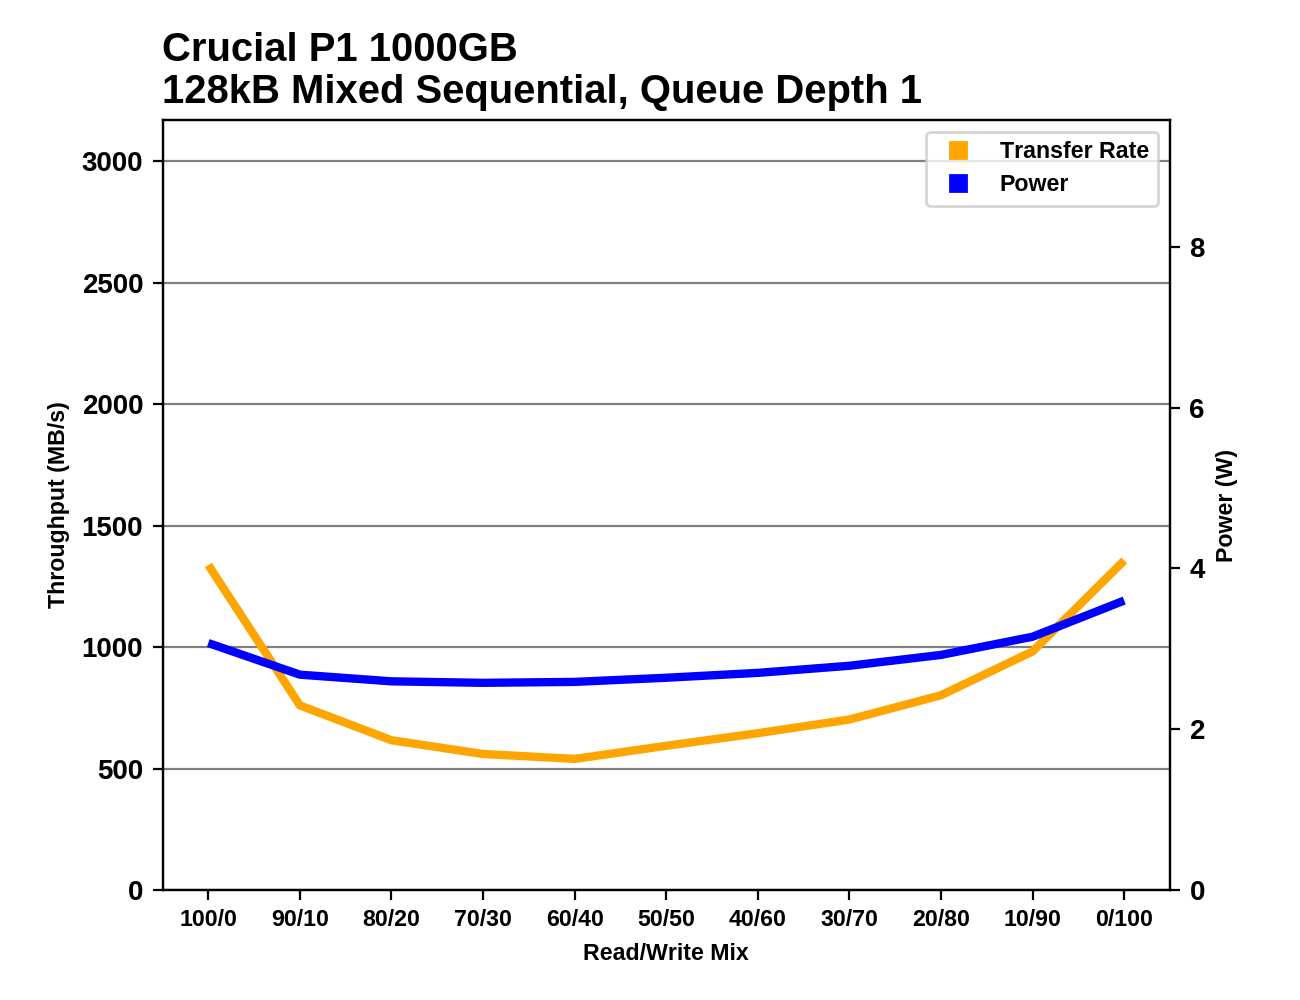
Mixed Sequential Performance
Our test of mixed sequential reads and writes differs from the mixed random I/O test by performing 128kB sequential accesses rather than 4kB accesses at random locations, and the sequential test is conducted at queue depth 1. The range of mixes tested is the same, and the timing and limits on data transfers are also the same as above.
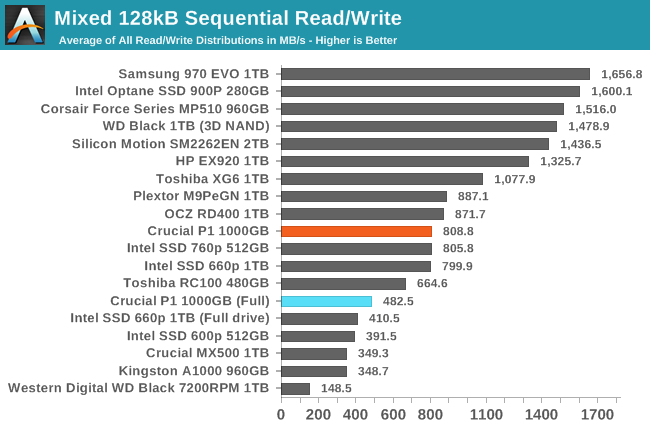
The performance of the Crucial P1 on the mixed sequential I/O test is better than most entry-level NVMe SSDs and comes close to some of the slower high-end drives. Even when the test is run on a full drive, the P1 remains faster than SATA SSDs, and its full-drive performance is slightly better than the Intel 660p.
 |
|||||||||
| Power Efficiency in MB/s/W | Average Power in W | ||||||||
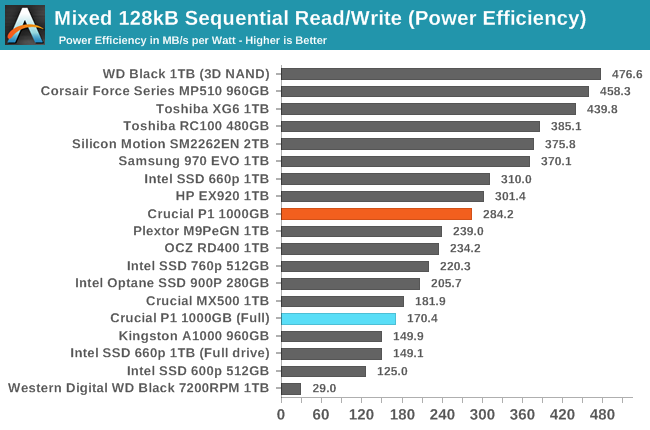
The power efficiency of the Crucial P1 on this test is about average for an entry-level NVMe drive. When the test is run on a full drive, the reduced performance causes efficiency to take a big hit, but it ends up being only slightly less efficient than the Crucial MX500 SATA SSD.
 |
|||||||||
The Crucial P1 has decent performance at either end of the test, when the workload is either very read-heavy or very write-heavy. Compared to other entry-level NVMe drives, the P1 starts out with better read performance and recovers more of its performance toward the end of the test than many of its competitors. The minimum reached at around a 60/40 read/write split is faster than a SATA drive can manage but is unremarkable among NVMe drives. When the test is run on a full drive, performance during the more read-heavy half of the test is only slightly reduced, but things get worse throughout the write-heavy half of the test instead of improving as write caching comes more into play.
Power Management Features
Real-world client storage workloads leave SSDs idle most of the time, so the active power measurements presented earlier in this review only account for a small part of what determines a drive's suitability for battery-powered use. Especially under light use, the power efficiency of a SSD is determined mostly be how well it can save power when idle.
For many NVMe SSDs, the closely related matter of thermal management can also be important. M.2 SSDs can concentrate a lot of power in a very small space. They may also be used in locations with high ambient temperatures and poor cooling, such as tucked under a GPU on a desktop motherboard, or in a poorly-ventilated notebook.
| Crucial P1 NVMe Power and Thermal Management Features |
|||
| Controller | Silicon Motion SM2263 | ||
| Firmware | P3CR010 | ||
| NVMe Version |
Feature | Status | |
| 1.0 | Number of operational (active) power states | 3 | |
| 1.1 | Number of non-operational (idle) power states | 2 | |
| Autonomous Power State Transition (APST) | Supported | ||
| 1.2 | Warning Temperature | 70 °C | |
| Critical Temperature | 80 °C | ||
| 1.3 | Host Controlled Thermal Management | Supported | |
| Non-Operational Power State Permissive Mode | Not Supported | ||
The Crucial P1 includes a fairly typical feature set for a consumer NVMe SSD, with two idle states that should both be quick to get in and out of. The three different active power states probably make little difference in practice, because even in our synthetic benchmarks the P1 seldom draws more than 3-4W.
| Crucial P1 NVMe Power States |
|||||
| Controller | Silicon Motion SM2263 | ||||
| Firmware | P3CR010 | ||||
| Power State |
Maximum Power |
Active/Idle | Entry Latency |
Exit Latency |
|
| PS 0 | 9 W | Active | - | - | |
| PS 1 | 4.6 W | Active | - | - | |
| PS 2 | 3.8 W | Active | - | - | |
| PS 3 | 50 mW | Idle | 1 ms | 1 ms | |
| PS 4 | 4 mW | Idle | 6 ms | 8 ms | |
Note that the above tables reflect only the information provided by the drive to the OS. The power and latency numbers are often very conservative estimates, but they are what the OS uses to determine which idle states to use and how long to wait before dropping to a deeper idle state.
Idle Power Measurement
SATA SSDs are tested with SATA link power management disabled to measure their active idle power draw, and with it enabled for the deeper idle power consumption score and the idle wake-up latency test. Our testbed, like any ordinary desktop system, cannot trigger the deepest DevSleep idle state.
Idle power management for NVMe SSDs is far more complicated than for SATA SSDs. NVMe SSDs can support several different idle power states, and through the Autonomous Power State Transition (APST) feature the operating system can set a drive's policy for when to drop down to a lower power state. There is typically a tradeoff in that lower-power states take longer to enter and wake up from, so the choice about what power states to use may differ for desktop and notebooks.
We report two idle power measurements. Active idle is representative of a typical desktop, where none of the advanced PCIe link or NVMe power saving features are enabled and the drive is immediately ready to process new commands. The idle power consumption metric is measured with PCIe Active State Power Management L1.2 state enabled and NVMe APST enabled if supported.
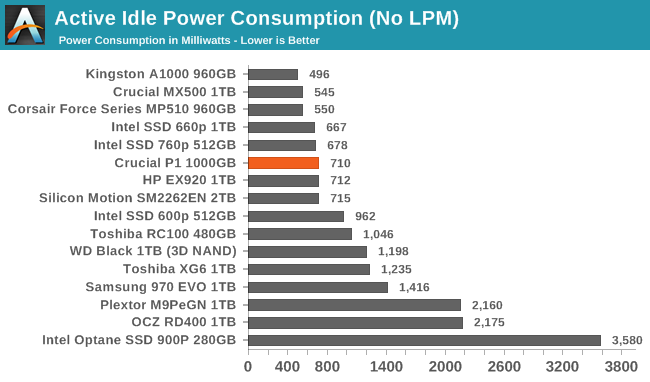
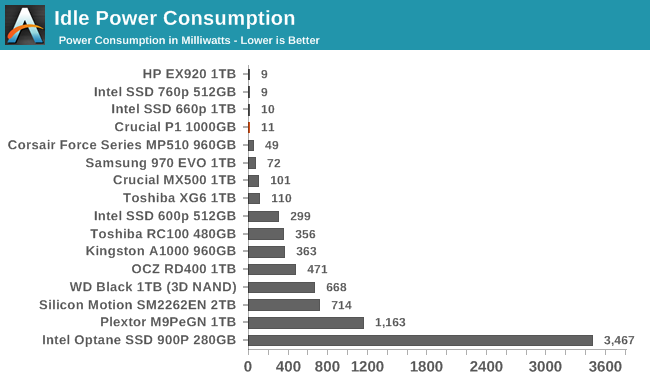
The idle power consumption numbers from the Crucial P1 match the pattern seen with other recent Silicon Motion platforms. The active idle draw is a bit higher for the P1 than the 660p due to the latter having less DRAM, but both do very well when put to sleep.
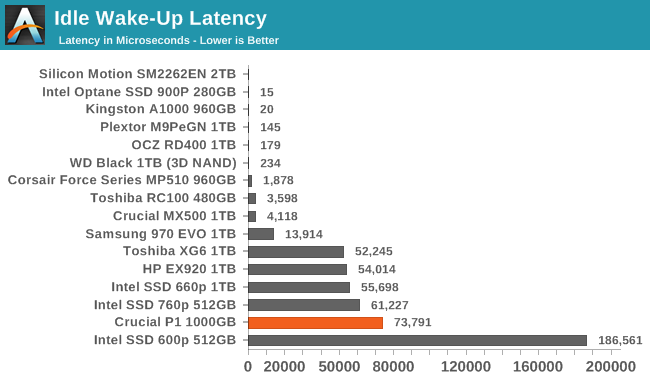
The wake-up latency of over 73ms for the Crucial P1 is fairly high, and definitely much worse than what the drive advertises to the operating system. This could lead to some responsiveness problems if the OS is misled into choosing an overly-aggressive power management strategy.
Conclusion
The Crucial P1 SSD doesn't leave us particularly excited about the near-term prospects for QLC NAND in the consumer SSD market. The P1 is a decent entry-level NVMe SSD for less intensive workloads, but the wide gap between its best and its worst performance means the P1 comes with more caveats than most of its competition.
The Crucial P1 relies very heavily on its SLC cache to provide high performance, and that cache shrinks as the drive fills up. When the drive is full, a very write-heavy workload can overflow the cache and severely impact write speeds and even read performance to some extent. However when the drive isn't close to full, it is nearly impossible to fill the SLC cache with a realistic workload, and the Crucial P1 performs at least as well as any other entry-level NVMe drive, and sometimes rivals high-end NVMe drives. Compared to the Intel 660p, the SLC cache on the Crucial P1 seems to be more write-oriented and is not as good at accelerating read operations. It seems like the P1 may be a bit quicker to evict data from the cache and compact it into QLC blocks.
Overall the Crucial P1 is primarily aimed at consumer machines, and that definitely seems like the segment it's best suited for. A typical consumer use case would involve most of the large data on the drive coming from things like movies and video games that are rarely modified, as opposed to workstation workloads that generate massive files that constantly change. This is helpful to the P1 because it reduces the actual amount of writing the drive needs to do, though it does mean that the drive's variable-size SLC cache could end up quite small. On balance, even that small cache should be adequate given the limited amount of data that does change with most consumer workloads; though to be sure, overflowing the SLC cache is something that would be far more noticeable on the P1 than most TLC-based SSDs. But it is still not something that will happen to most consumers often enough to worry about.
That leaves the Crucial P1 as usually being very fast, and definitely faster overall than any SATA SSD. The use of QLC NAND doesn't cripple the drive, and is a detail that most consumers don't have to care about. Even at its worst, the P1 is still faster and more efficient than a mechanical hard drive. NVMe SSDs should aspire to more than that, but this will probably be true even of QLC SATA drives as long as they also avoid the low capacity points where high performance is impossible.
| NVMe SSD Price Comparison | ||||
| 240-280GB | 480-512GB | 960GB-1TB | 2TB | |
| Crucial P1 | $109.99 (22¢/GB) | $219.99 (22¢/GB) | Coming Soon | |
| Intel 660p | $99.99 (20¢/GB) | $189.99 (19¢/GB) | $349.99 (17¢/GB) | |
| MyDigitalSSD SBX | $54.99 (21¢/GB) | $94.99 (19¢/GB) | $219.99 (21¢/GB) | |
| Kingston A1000 | $56.99 (24¢/GB) | $97.99 (20¢/GB) | $219.99 (23¢/GB) | |
| MyDigitalSSD BPX Pro | $74.99 (31¢/GB) | $129.99 (27¢/GB) | $259.99 (27¢/GB) | $519.99 (27¢/GB) |
| ADATA XPG SX8200 | $62.99 (26¢/GB) | $107.99 (22¢/GB) | $214.99 (22¢/GB) | |
| HP EX920 | $73.99 (29¢/GB) | $119.99 (23¢/GB) | $199.99 (20¢/GB) | |
| WD Black (2018) | $85.99 (34¢/GB) | $138.46 (28¢/GB) | $259.75 (26¢/GB) | |
| Samsung 970 EVO | $87.90 (35¢/GB) | $147.99 (30¢/GB) | $227.99 (23¢/GB) | $577.95 (29¢/GB) |
| SATA Drives: | ||||
| Crucial MX500 | $52.99 (21¢/GB) | $84.95 (17¢/GB) | $154.99 (15¢/GB) | $328.99 (16¢/GB) |
| Samsung 860 EVO | $57.99 (23¢/GB) | $82.99 (17¢/GB) | $162.99 (16¢/GB) | $347.99 (17¢/GB) |
The downsides of QLC NAND are pretty easy to accept if they come with a significant price cut, but that is not yet the case for the Crucial P1 or the Intel SSD 660p. The Crucial P1 is 22 cents per GB and the Intel 660p is 19 cents per GB, so Micron obviously needs to drop their prices at least a little bit to be at all competitive. Meanwhile, mainstream SATA SSDs are about 16–17 cents per GB for 512GB and larger capacities, and there are some high-performance TLC-based NVMe SSDs in the 20-22 cents per GB range.
Ultimately if you are going to pay extra for a NVMe SSD instead of a SATA drive, at current prices there are far more compelling options than the Crucial P1 and Intel 660p. We're accustomed to seeing entry-level NVMe SSDs get undercut by more popular high-performance drives as prices in general trend downward, and the two QLC drives we have so far on the consumer market are continuing that pattern. When QLC comes to the SATA SSD market, prices will need to be at or below 13 cents per GB to avoid repeating this problem.


